Strategies correlation
When we use several strategies together, it's essential to assess whether the results are very similar, which would indicate a certain degree of correlation between them. Correlation can be either positive, meaning very close results, or negative, where the returns are precisely opposite. Both cases can be a problem since strategies with a very positive correlation tend to amplify the risk of losing trades. On the other hand, strategies with a very negative correlation tend to cancel each other when others' loss reduces one's profit.
The best scenario is when strategies do not correlate. In this case, the value is close to zero, indicating that it is not possible to verify a similarity between the results. It is worth noting that correlation is calculated based on historical results. It will always depend on the amount of data and the corresponding period, and it can change over time.
It is crucial to evaluate the correlation in conjunction with joint trades information. Suppose the correlation is positive, and there is a high probability of the strategies trading simultaneously. In that case, the strategies are likely similar, and it's not worth keeping both active in a portfolio.
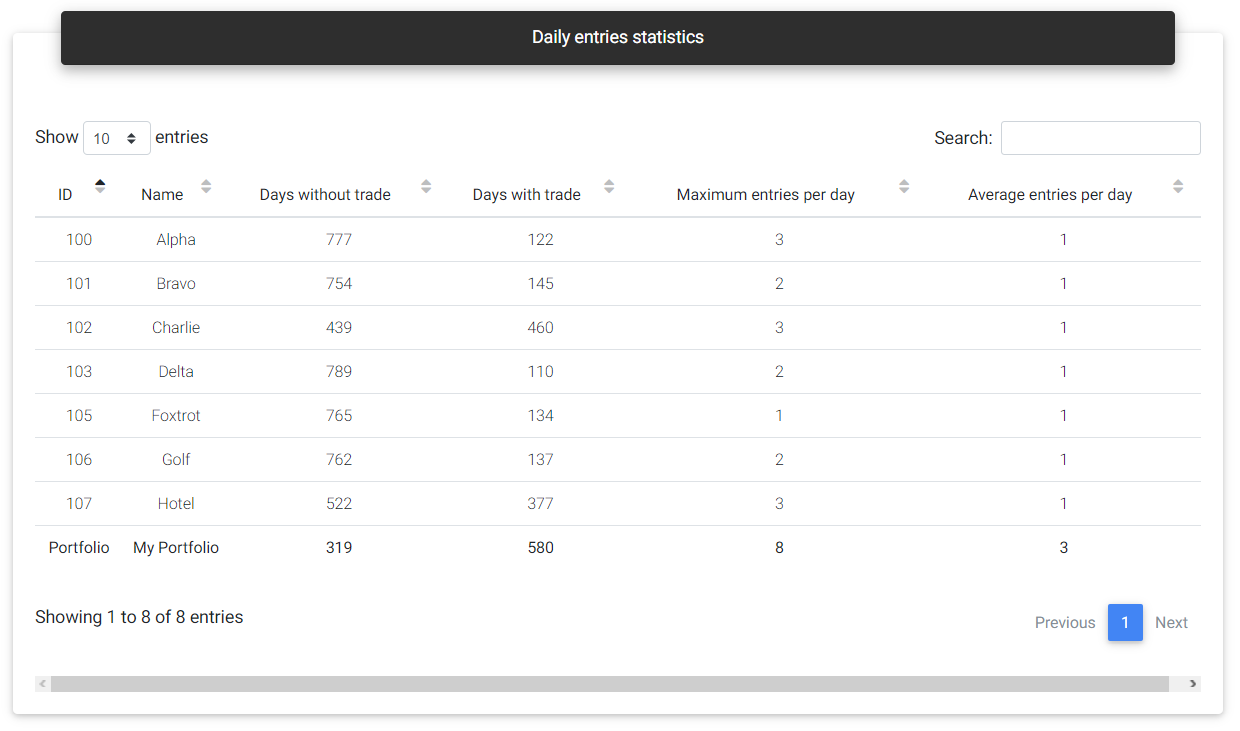
Daily entries statistics
This table shows the daily entry statistics for individual strategies and the complete portfolio. You can see the number of days with and without trades and also the maximum number of trades performed by a strategy in a single day.
Daily entries
Strategy correlation
This section presents the correlation matrix between the strategies. Correlation is calculated in pairs, and a graphical matrix with a color heatmap is created, indicating the correlation value corresponding to the strategy pair. Hovering the matrix, you can see the corresponding strategies' names to make identification easier. The matrix is symmetrical concerning the main diagonal. The same values appear in the lower and upper part of the table, in a relationship between the same strategies.
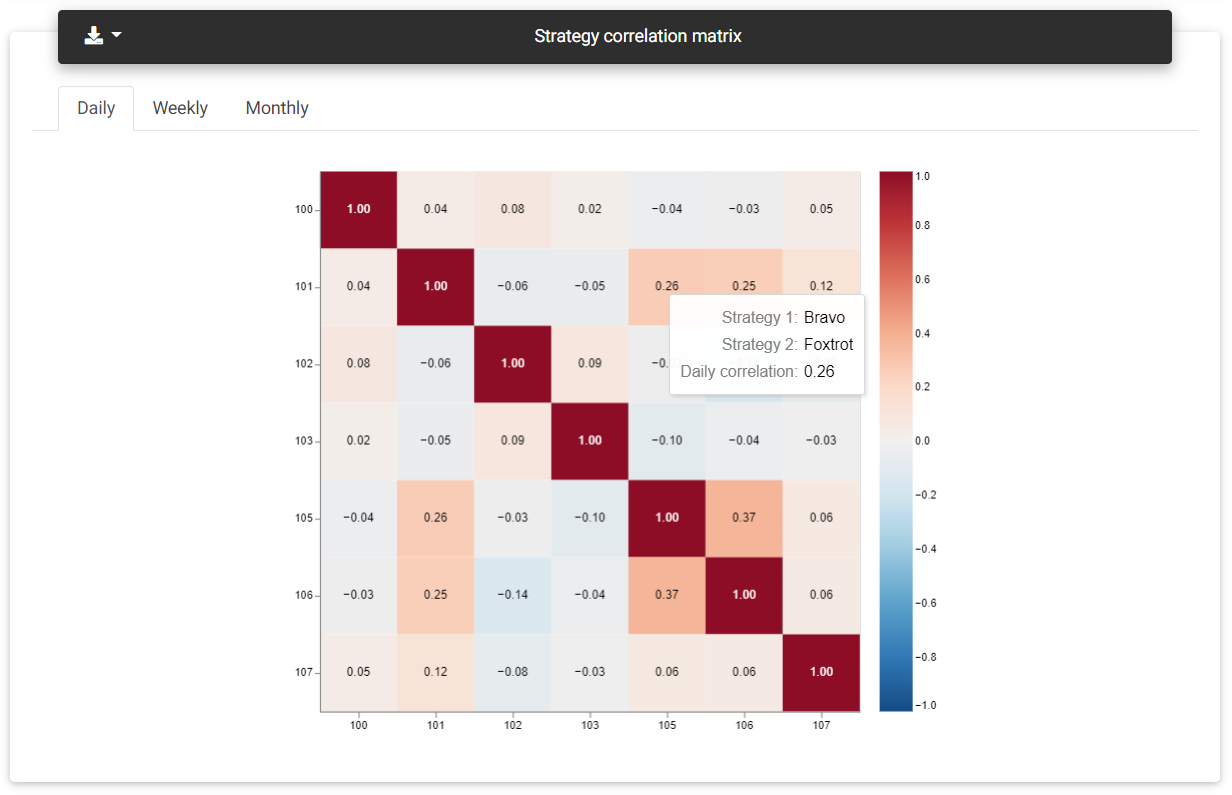
Correlation matrix
Correlation is calculated based on three types of returns: daily, weekly, and monthly. You can view each period's correlation by selecting the corresponding tab at the top of the matrix.
The correlation values are always in the range between -1.0 and +1.0. The colors are represented on a scale from blue to red, respectively. The redder, the more positive correlation is, while the blue cells show a negative correlation, with opposite results. Diagonally you will see several red boxes with a value of 1.0 in the positions where a strategy evaluates fronting itself.
Joint trades probability
This section shows a matrix with the probability of two strategies to operate simultaneously in a given period. The odds range from 0.0 to 1.0, indicating none and 100% chance, respectively. You can verify joint trades in three possible time intervals: on the same day, in the same period (morning, afternoon, evening, and night), and at the same hour.
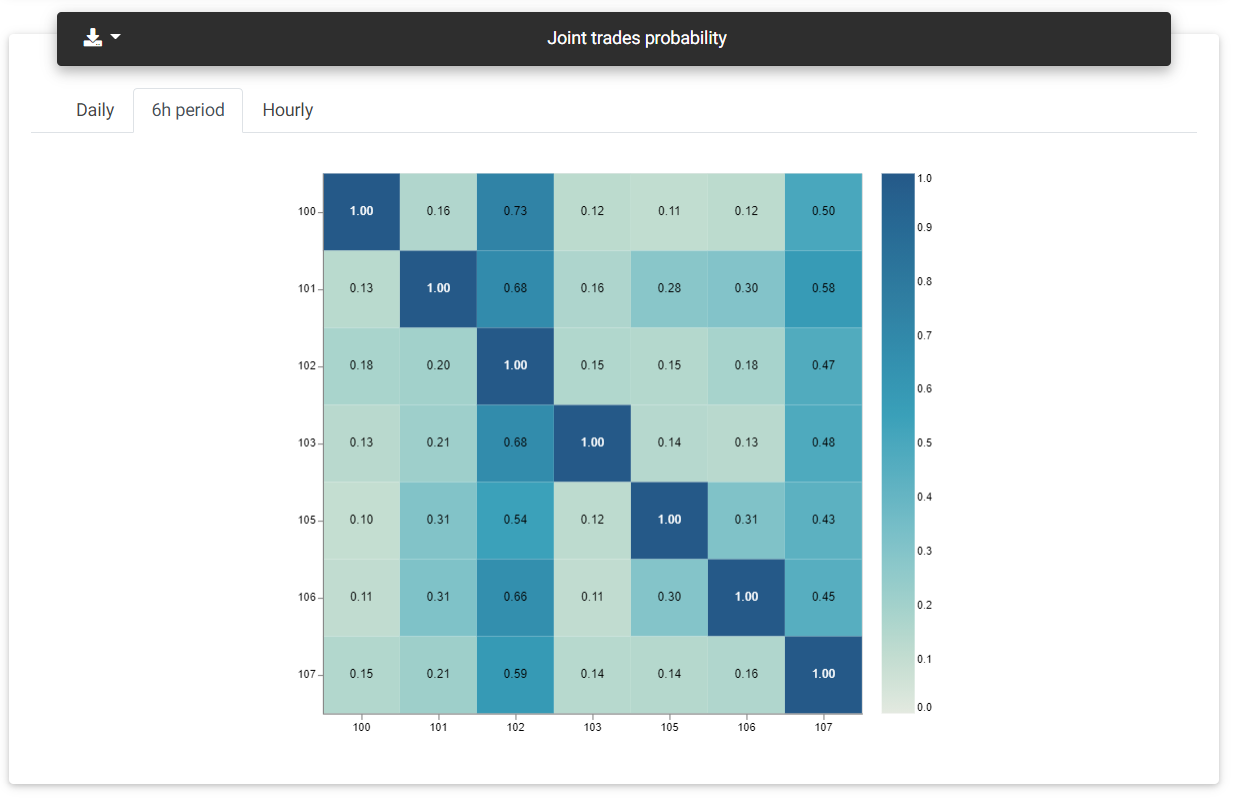
Joint trades
Unlike correlation, the numbers can be different according to the reference used. For example, suppose two strategies A and B, where A trades twice as much as B, but whenever B starts a trade, A trades. Analyzing the probability of A entering if B is also trading, the value would be 1.0. On the other hand, the probability of B entering if A is trading would be only 0.5.
Read next: Portfolio Allocation