Optimization Analysis
With the Trading Portfolios' Optimization Analysis tool, you can evaluate the optimization results in more detail. You will need a file with the optimization results, including all the steps performed with the parameter values and the corresponding results.
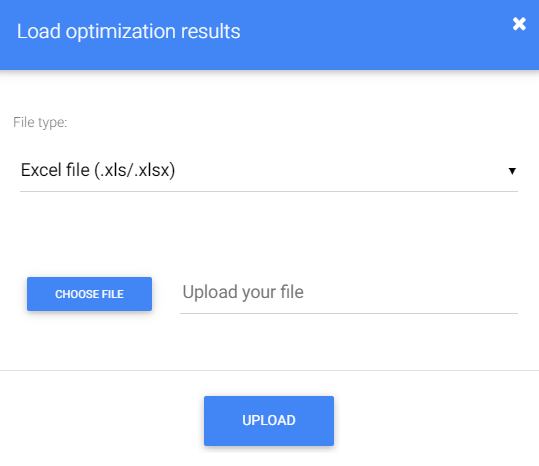
Upload file
You can use any table file in Excel format (.xls/.xlsx), CSV (with comma as separator), or a file exported by MT5 platform in XML format. The most important thing is that the file needs to have result metrics and parameters names in the first row, and the following rows must contain the optimization steps. Column names identified in the first row will be available in the tool to select the desired metrics and the optimized parameters. Below is an example of an optimization file:
| Pass | Result | Profit | Expected Payoff | Profit Factor | Recovery Factor | Sharpe Ratio | Custom | Equity DD% | Trades | inSLValue | inTPValue | inBandsPeriod |
|---|---|---|---|---|---|---|---|---|---|---|---|---|
| 754 | 3022.50 | 6512.00 | 22.0 | 1.91641 | 14.97012 | 0.32110 | 0 | 3.81 | 296 | 2.2 | 20 | 88 |
| 738 | 3022.50 | 6512.00 | 22.0 | 1.91641 | 14.97012 | 0.32110 | 0 | 3.81 | 296 | 2.2 | 18 | 88 |
| 722 | 3022.50 | 6512.00 | 22.0 | 1.91641 | 14.97012 | 0.32110 | 0 | 3.81 | 296 | 2.2 | 16 | 88 |
| 177 | 2986.40 | 5526.00 | 16.44643 | 1.65653 | 16.30089 | 0.25102 | 0 | 3.52 | 336 | 2.1 | 20 | 64 |
| 161 | 2986.40 | 5526.00 | 16.44643 | 1.65653 | 16.30089 | 0.25102 | 0 | 3.52 | 336 | 2.1 | 18 | 64 |
After loading a file, you must select three metrics for evaluation (Profit, Drawdown, Result, Average trade, etc.) in the main form and the variables you have optimized for further individual parameter analysis.
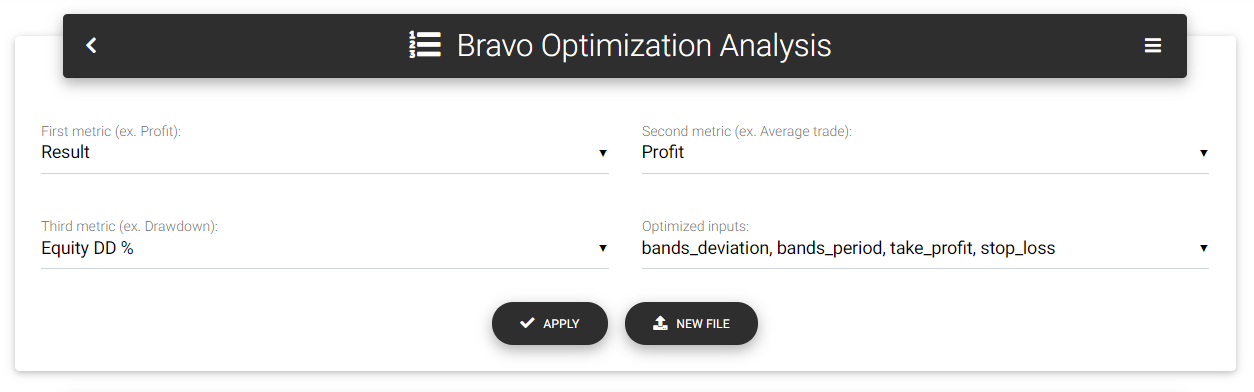
Settings
Result analysis
For each selected metric, the tool will display a chart with the corresponding value for each step. With this, it's possible to know how the results are distributed during the optimization steps.
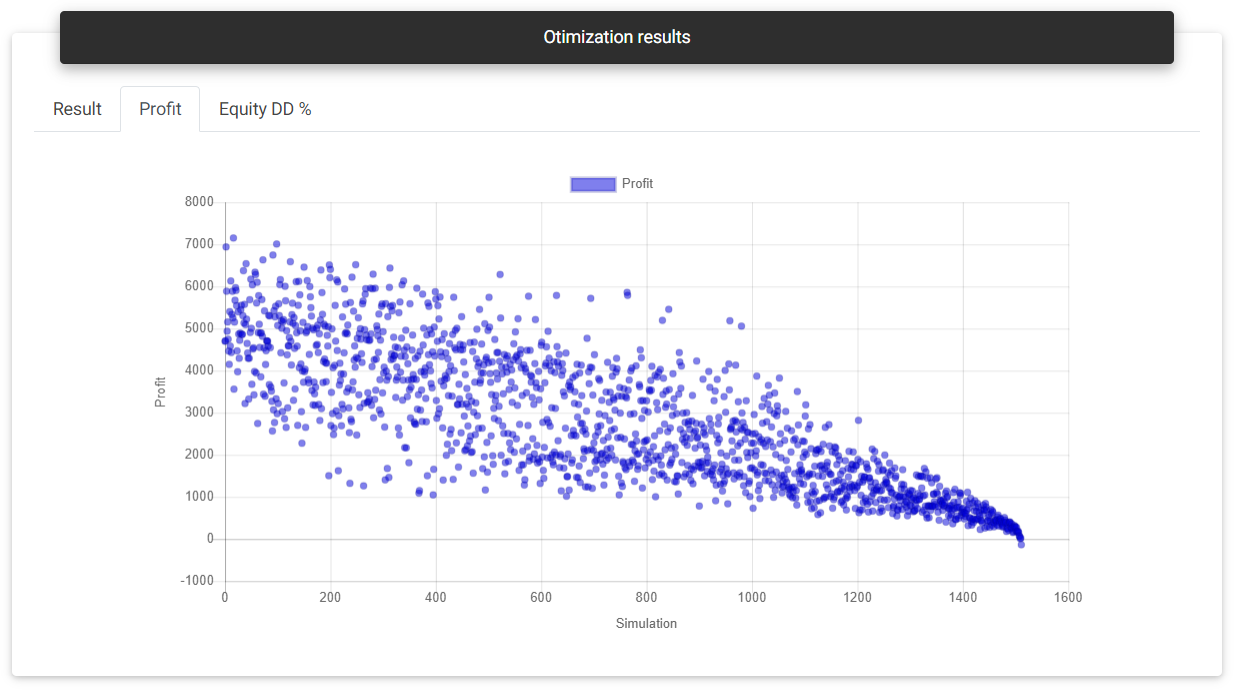
Optimization results
There is a table with statistical data for the metrics, indicating mean, minimum, maximum, and standard deviation for each metric. In addition to the table, you can view the data using histograms, which show how many optimization steps exist for each final result range.
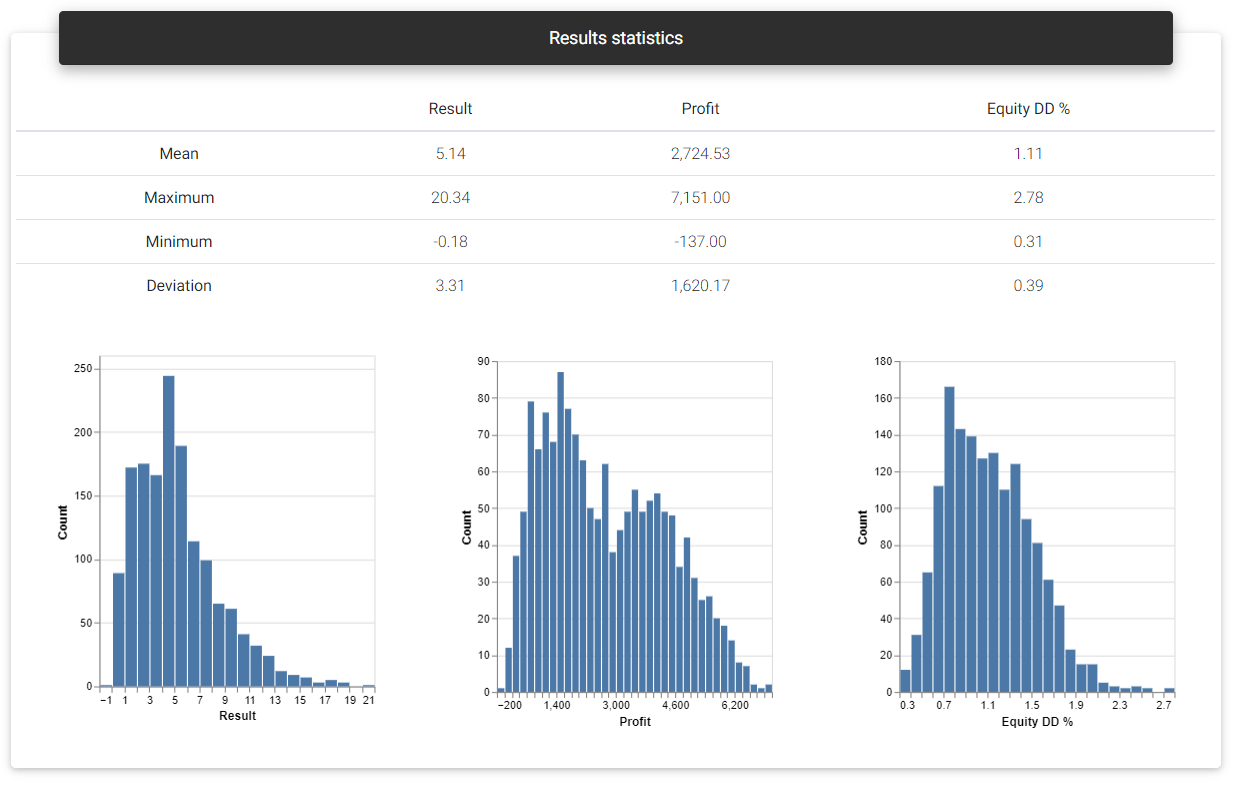
Results statistics
Parameter changes
Parameter changes are the most exciting information in the Optimization Analysis tool. You can see the effect of changing each of the parameters on the final result represented by the selected metrics.
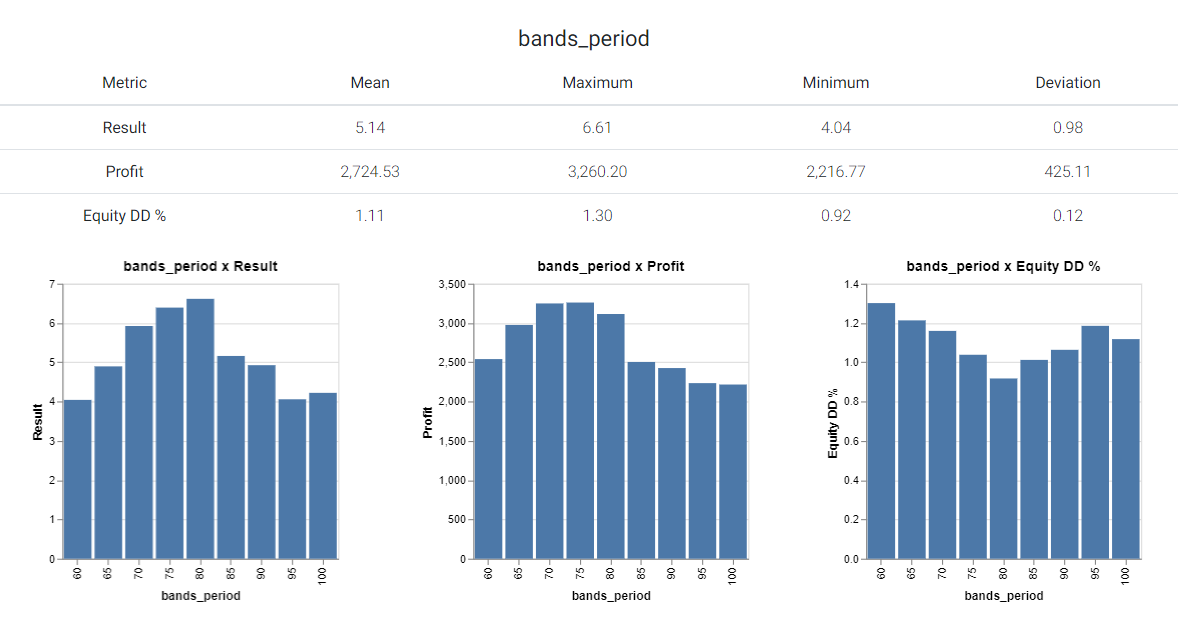
Parameter changes
For each optimized parameter, a table presents the mean, minimum, maximum, and standard deviation for the metrics based on the input values assigned. In addition to the table, you see this distribution in histograms, which allow you to quickly identify robust regions where small variations do not generate a significant change in the results. When you find a single isolated value generating an excellent result, while the nearby values are not satisfactory, this parameter value is probably not robust. It has a great chance of not working well in live trading.
Optimization data
This section presents a table with the data read from the uploaded file. You can use this for checking data in the form of a table.
Read next: Compare Strategies