Dashboard
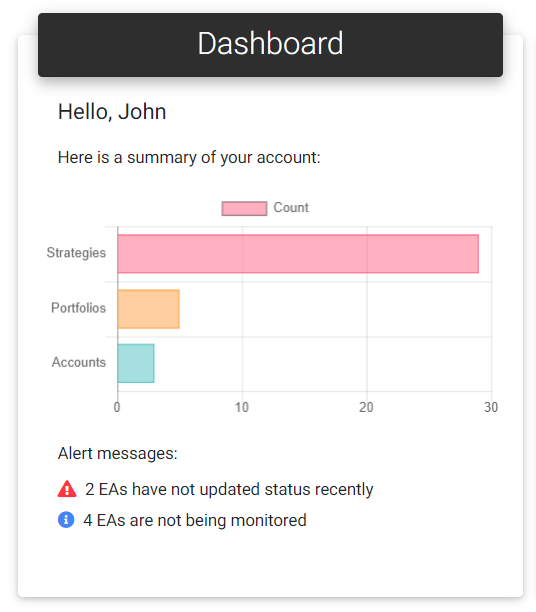
When you log in, you will be automatically redirected to the Dashboard page, where some relevant information is shown, in addition to listing all the strategies, portfolios, accounts, and symbols in your account.
You will see a bar chart on the main card indicating the number of existing strategies, portfolios, and accounts. Besides, there is an area for displaying alerts, which may refer to EAs supervision in trading accounts or information about subscription events.
Account summary
For users with an active subscription, on the card "Real account results," it's possible to see a summary of real accounts' results of all strategies that have this type of history available. You can see the total profit and the profit for the current day, week, month, and year. A simple chart indicates the "Profitability," which corresponds to the percentage of strategies that have been profitable in real accounts.
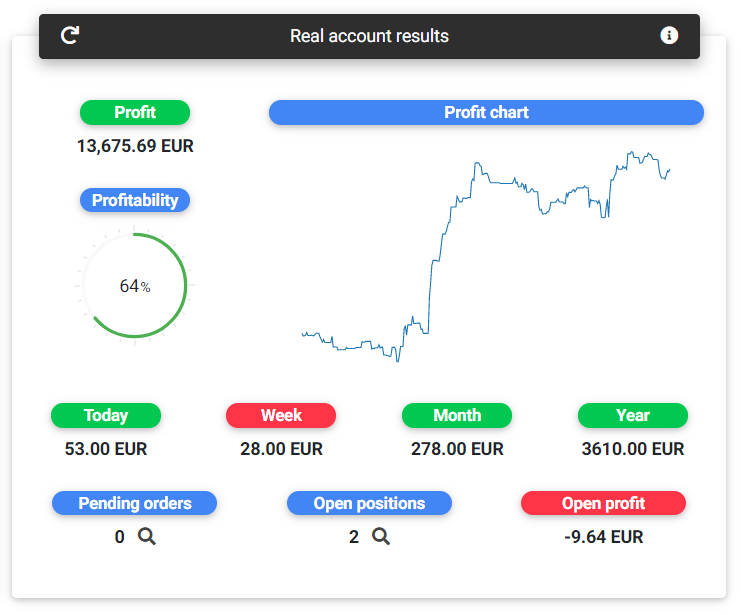
Real account results
When publishing agents are used to send data directly from trading accounts, all the open positions and pending orders will also be visible here, and the open profit/loss. To ensure a better user experience, data in this card is cached for some time, so there might be some delay in presenting closed operations results.
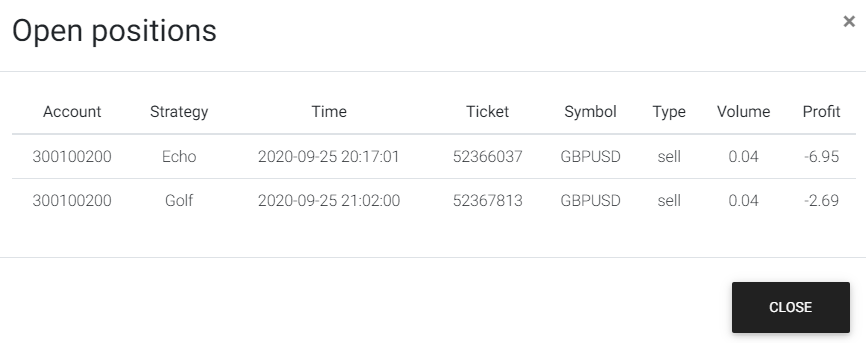
Open positions
Right below, there is a card called "Strategies overview," where some characteristics of the strategies can be observed, including the number of strategies by symbol, trading style, and also trade duration.
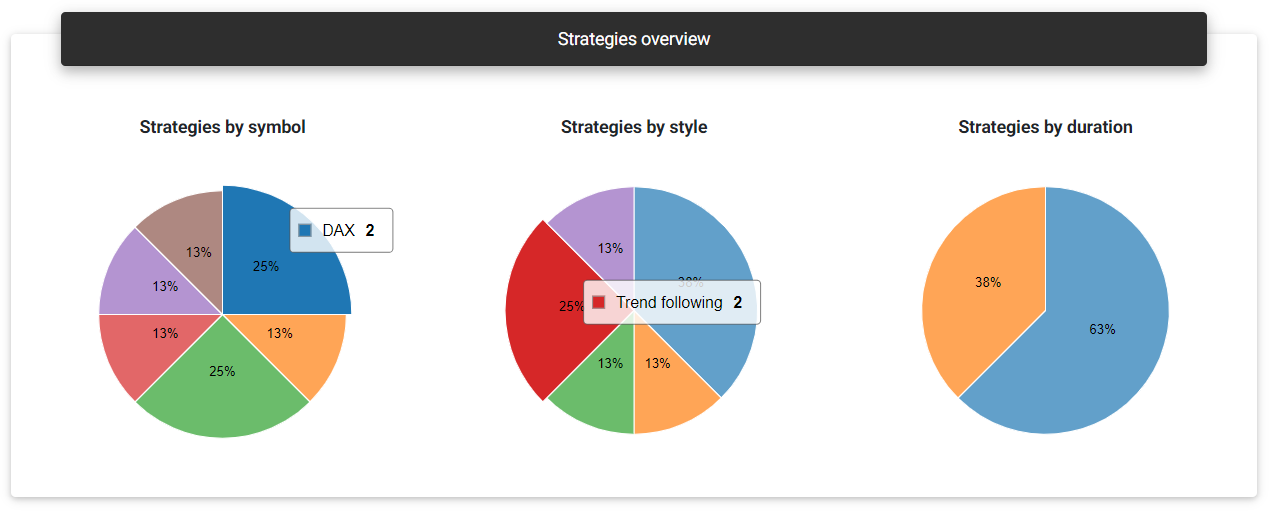
Strategies overview
Finally, on the Dashboard, you will find tables with a list of portfolios, strategies, accounts, and symbols. You can observe some primary data and directly access the details by clicking on each entry. There are also links to create new items at the top of each table.
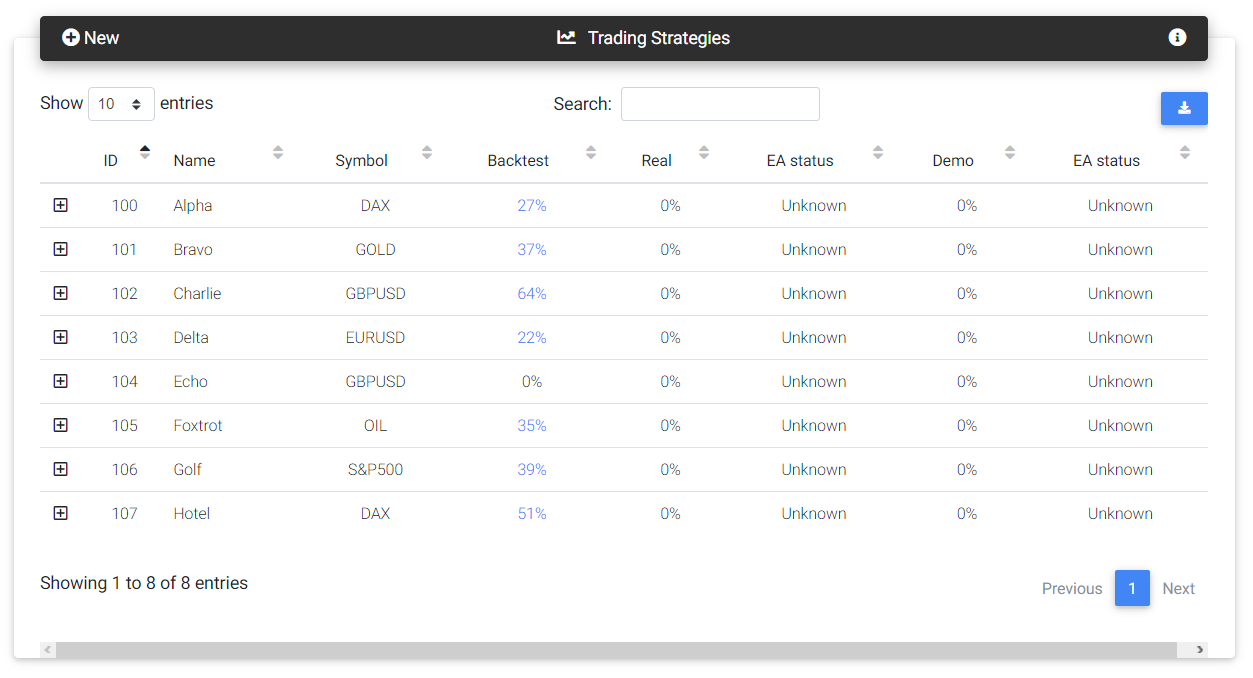
Trading strategies
Read next: Trade Symbols