Strategies
Strategies are the basis of all app functionalities. Consider a strategy as a combination of a trading setup, symbol, and timeframe. In theory, you can have the same strategy trading multiple assets, but according to this app's structure, you should consider a different strategy for each symbol. However, there may be specific cases where the symbol should be considered a basket of assets, like with long & short trades.
Each strategy in your profile must have a unique identification number, which in general will be the same as the number that identifies the strategy on the trading platform. Automatic publishing agents will look for these numbers in trading accounts and bring the trading history to the database. If needed, publishing agents allow the mapping of these identifiers to different magic numbers running on accounts.
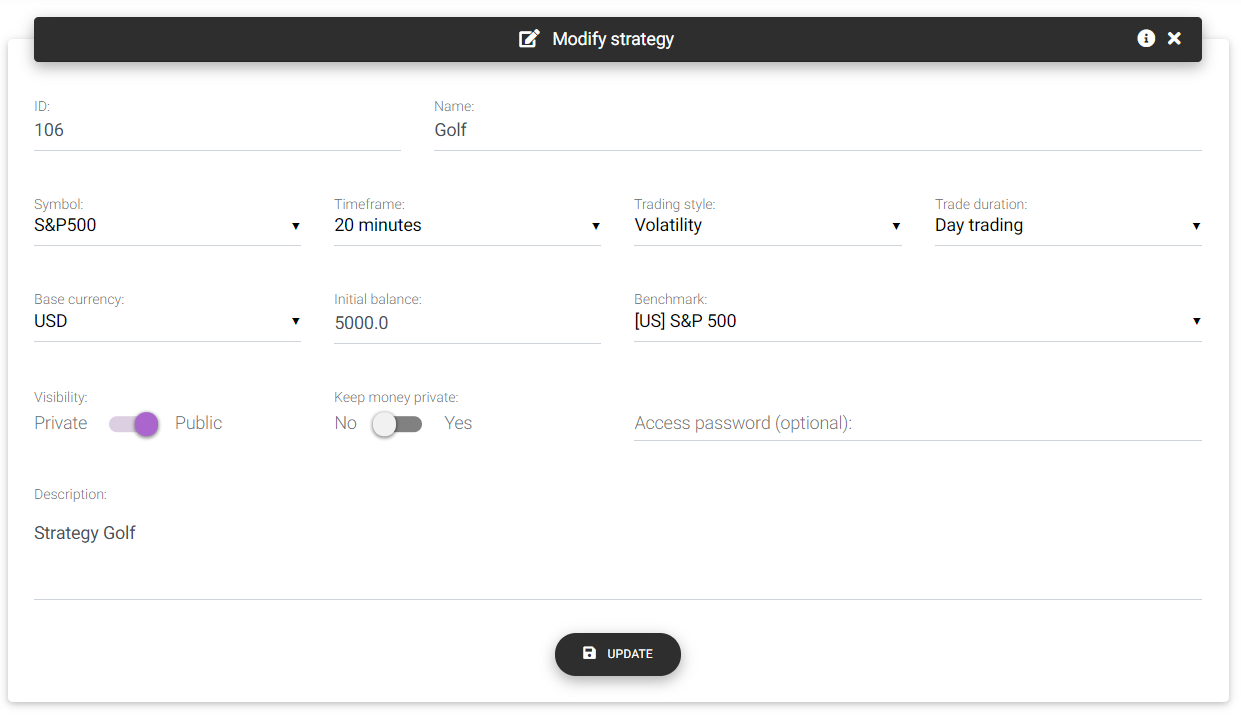
Strategy form
When you create a new strategy, you must fill in the following information:
ID: Numeric identifier for the strategy. This identifier should be unique in your profile, and ideally, it should be the same number used to identify EA transactions in demo and real accounts.
Name: This is the name of the strategy, which will identify it in the various tools.
Symbol: The symbol or basket of assets traded by the strategy.
Timeframe: The timeframe chosen to run the strategy. You can select the timeframe from a list of the most common options. If your strategy timeframe is not on this list, don't worry, this is just informative and will not make any difference in the calculations.
Trading style: Indicates the trading style of the strategy, such as breakout, trend following, mean reversion, etc. Your system can fit into more than one option, so select the one that makes more sense to you. This classification is used to analyze the distribution of strategies in your profile or portfolio by trading style.
Trading duration: Select the type of strategy according to the duration of the trades. If trades are opened and closed on the same day, the option should be "Day trading". If the trades last for a few days or weeks, select "Swing trading". On the other hand, if trades can span weeks or months, consider the option "Position trading."
Base currency: Indicates the default currency used for presenting the strategy results on the details page and the initial balance used in the simulations. History data currency is automatically detected, and the app converts performance results to the strategy's default currency. In the individual reports of each history type, the currency will remain unchanged.
Initial balance: This is the initial deposit considered in the balance evolution simulations based on historical results. The currency is the one defined in "Base currency."
Benchmark: Select the benchmark symbol to compare the strategy's performance.
Visibility: Defines whether your strategy will be public and accessible by everyone who has a shared link or views your public profile. Other people cannot view private strategies.
Keep money private: If your strategy is public, you can choose not to show financial profit and balance figures, as well as the volume traded. If you select this option as "Yes", people will see only the results in percentage and points/pips.
Access password: If your strategy is public, it is possible to define an access password in this field, which must be entered by visitors when trying to view your strategy. If this field is empty, visitors won't need to enter a password.
Description: This is a brief description of the strategy. Use it to include any additional details that are not clear with the name and other parameters.
Strategy detail
On the strategy information page, accessible through the top menu or dashboard, it is possible to monitor and control the various tools available to perform the analysis.
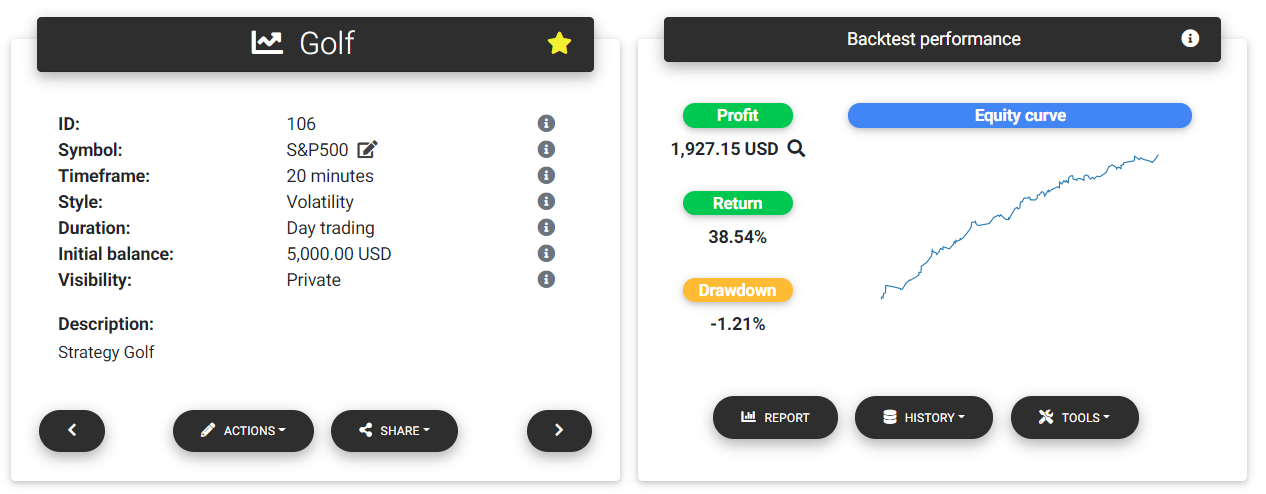
Strategy summary and backtest performance
At first glance, it is possible to check a summary of strategy information and its historical results in the backtest, demo account, and real account. Along with the main information, there are links to modify or delete the strategy in the Actions button.
Note: When you delete a strategy, all historical data will also be deleted and can only be recovered if sent once again to the server.
In the Actions button, you will also find a link to archive the strategy. The app will not count on archived strategies when calculating the statistics of portfolios and profiles.
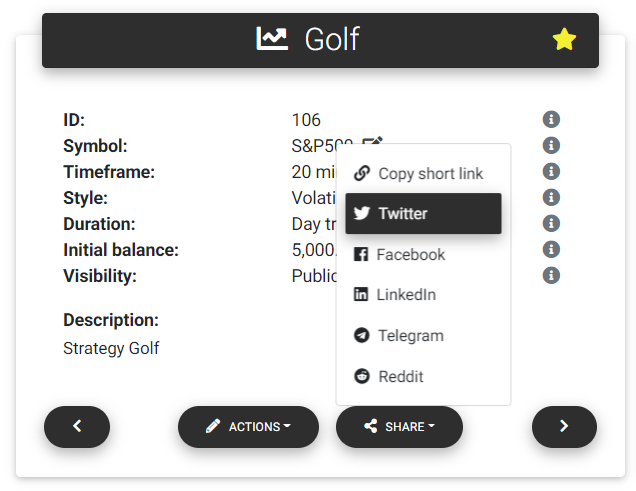
Share the strategy
If the strategy is public, you can directly share the strategy using social media like Twitter, Facebook, LinkedIn, Telegram, Reddit, or copy a short link for sharing in your messages.
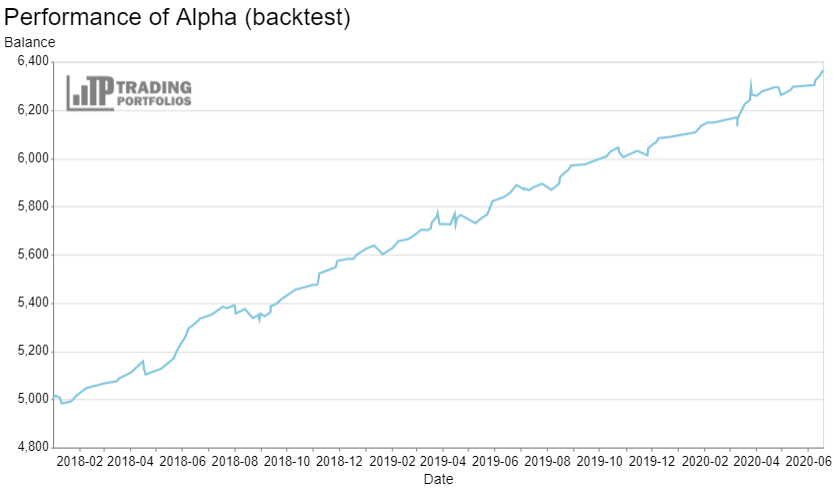
For each type of available history, raw performance data are presented, including profit, return, and drawdown, in addition to a simple chart to visualize the balance evolution over the period. This performance information does not consider trading costs. These will be applied when building a detailed report. In each of these sections, it is possible to load historical data and access the analysis tools available.
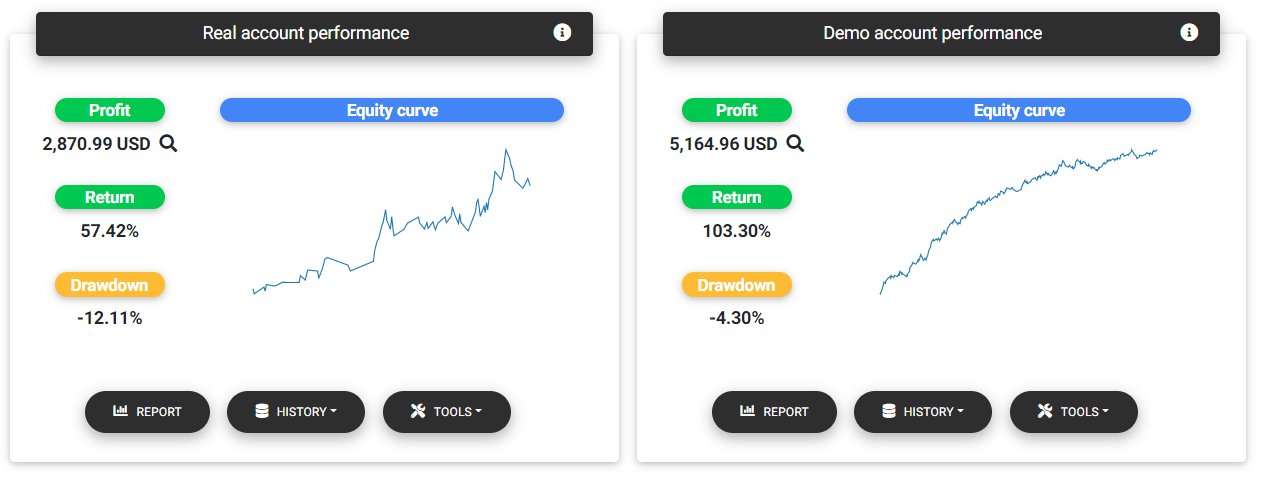
Real and demo accounts performance
Load history data
You can load historical data manually using multiple file formats. The app currently supports report files from MetaTrader 5 (html and xlsx formats) and MetaTrader 4 (html) platforms. Anyway, it is possible to load data from any platform using the CSV or Excel file templates described below. We are working to support other report types in the future.
Tip: For MetaTrader 4 and MetaTrader 5 platforms, it is possible to automatically send trades from demo and real accounts using publishing agents available for download.
If you want to send a new file with historical data, click on the “History” button and select the “Load data” option.
A form for selecting some parameters related to the history file will be presented, with the following fields:
Warning: Uploading new data does not delete previous data. If you want to replace all historical data, use the “Clear data” function before uploading a new file.
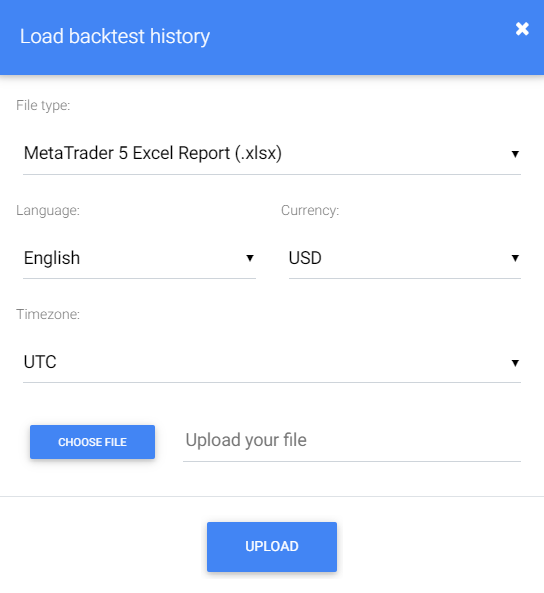
Upload history
File type: Select the option that corresponds to the file format you will send.
Language: Reports from MT4 and MT5 platforms can be generated in several languages, depending on the trading terminal's selection. The app supports some languages shown in the "Language" parameter, and you must select the option corresponding to your terminal. If the language used is not in the list, you can still modify your terminal's language to generate the report. When using the standard files based on templates 1 and 2, the language setting is not taken into account, and the columns must always be in English like shown in the model.
Currency: The currency of the account used to perform the backtest or generate the report. It must be the currency used to present the profits. It is crucial to select the correct currency for the conversion functions to work correctly. If your currency is not on the list, it means that the app does not currently support it. In this case, you can keep it as USD or any other that you consider closest to yours.
Timezone: This is the timezone related to the time tags of the history deals. It is usually the same timezone as your broker's server. The app will use this information to align the trades of the different strategies in the same timezone of your choice to calculate the daily results and analyze simultaneous entries. If you are unsure of what is the correct timezone, you can keep this option as UTC.
Tip: If you are having problems importing the report files from the MT4 and MT5 platforms, verify the file format and selected language, and check if they follow the report. You can try to send the English report to ensure that it is not an issue related to the selected language. If errors persist, contact support to assess the problem.
File templates
There are two templates for history files in CSV or Excel (xlsx) formats. With Template 1, the open and close deals are represented independently, each with an associated ticket. With Template 2, open and close operations are described on the same line, using only one ticket. Below you find a description of each column used in templates 1 and 2 and links to download the file templates.
Warning: For CSV files, the column separator must be a comma character (','), and for decimal numbers, the separator shall be a period ('.').
Template 1
Download template 1 files here: Excel (xlsx) | CSV
In this template, open and close deals are represented in different lines, and the following columns must be available:
Ticket: Deal identification number at the broker server.
Order: Identifier of the order that generated this deal.
Time: Date and time when the deal occurred in the format YYYY-MM-DD hh:mm:ss.
Symbol: Code of the traded instrument.
Volume: Volume executed in the deal.
Type: Deal type: "buy" or "sell"
Direction: Direction of the operation "in" for opening positions and "out" for closing.
Price: Deal execution price.
Stop Loss: Trigger price for stop loss (zero indicates no active sl).
Take Profit: Trigger price for take profit or stop gain (zero indicates no active tp).
Commission: Amount of commission charged by the broker to execute the order.
Swap: Swap paid or received with the transaction.
Profit: Trade profit, in the case of closing positions.
MAE: Maximum adverse excursion, that is, the largest negative price variation during the trade.
For long trades, it will be the minimum price during the trade minus the entry price. For short trades,
it will be the entry price minus the maximum price reached during the trade.
MFE: Maximum favorable excursion, that is, the largest positive price variation during the trade.
For long trades, it will be the maximum price reached during the trade minus the entry price. For short
trades, it will be the entry price minus the minimum price reached during the trade.
Comment: Comment associated with the deal for identification in history.
SL Triggered: "True" if the deal was generated after activating the stop loss, "False” otherwise.
TP Triggered: "True" if the deal was generated after activating the take profit, “False” otherwise.
Template 2
Download template 2 files here: Excel (xlsx) | CSV
In this template, open and close deals are represented in the same line, and the following columns must be available:
Ticket: Order or deal identification number at the broker server.
Symbol: Code of the traded instrument.
Volume: Volume executed in the deal.
Type: Open deal type: "buy" or "sell"
Open Time: Date and time when the position was opened in the format YYYY-MM-DD hh:mm:ss.
Open Price: Position opening price.
Stop Loss: Trigger price for stop loss (zero indicates no active sl).
Take Profit: Trigger price for take profit or stop gain (zero indicates no active tp).
Close Time: Date and time when the position was closed in the format YYYY-MM-DD hh:mm:ss.
Close Price: Position closing price.
Commission: Amount of commission charged by the broker to execute the order.
Swap: Swap paid or received with the transaction.
Profit: Trade profit.
MAE: Maximum adverse excursion, that is, the largest negative price variation during the trade.
For long trades, it will be the minimum price during the trade minus the entry price. For short trades,
it will be the entry price minus the maximum price reached during the trade.
MFE: Maximum favorable excursion, that is, the largest positive price variation during the trade.
For long trades, it will be the maximum price reached during the trade minus the entry price. For short
trades, it will be the entry price minus the minimum price reached during the trade.
Comment: Comment associated with the deal for identification in history.
SL Triggered: "True" if the deal was generated after activating the stop loss, "False” otherwise.
TP Triggered: "True" if the deal was generated after activating the take profit, “False” otherwise.
Tip: All loaded deals can be viewed in the section “Deals history,” in the tab corresponding to the history of interest.
Expert advisors supervision
We have made available an open-source library for MetaTrader platforms that can be used by developers to integrate EAs with the site supervision mechanism. For this to work, you must also run the publishing agent on the same terminal in which the EAs are running and enable the option to allow EAs supervision on the terminal.
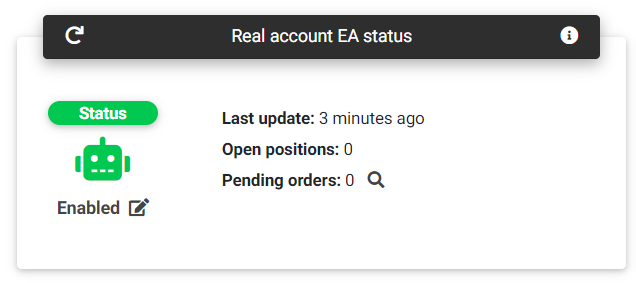
Real account EA status
When implementing this library, the EAs will periodically obtain user-defined status on the website and send feedback confirming the state changes to the server.
That way, you can know if an EA is active on account or if there was a crash on the terminal or even the deactivation of automated trading. If an EA does not update its status for a long time, the app will set the status as Unknown, which probably indicates that the robot is not running correctly.
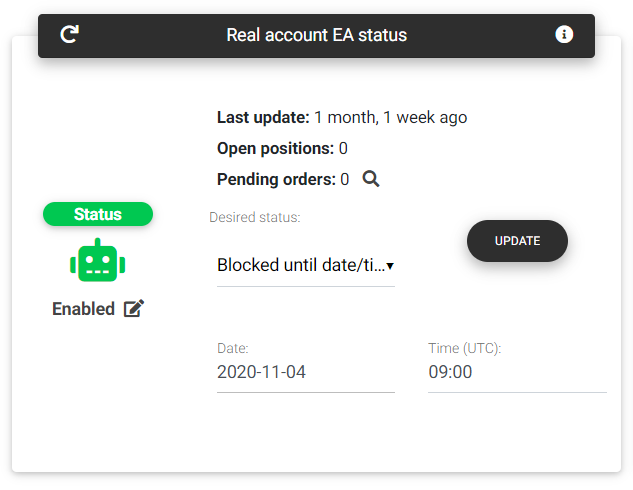
Change real account EA status
From the website, you can change the desired status for an EA by selecting one of the options Enabled, Disabled, or Blocked. For the latter option, you must specify a time limit for the blocking, when the state will automatically return to Enabled.
The EAs status section also indicates whether they have any open positions or pending orders placed. This information is obtained directly from the trading account through the publishing agents.
Show in your site
If you want to publish the results of your strategy on your own website, with data from backtest, demo account or real account, it is possible to include a simple chart using a line of code as the example below:
<iframe scrolling="no" width="100%" height="495" style="border:none;" title="Strategy performance"
    src="https://tradingportfolios.com/portfolios/user/strategy/chart/1/backtest/?height=400&width=container&data=balance">
</iframe>
This will allow you to embed a chart originating from the tradingportfolios.com website itself on your web page. For the chart to be displayed, you must set the strategy as public, and select whether you want to display charts of profit, balance, percentage return, or points.
External chart
The following parameters can be passed with the GET request directly with the URL:
height: Chart height in pixels.
width: Chart width in pixels or the string 'container' so that the chart automatically adjusts the width.
data: Type of data used to build the chart: balance, profit, points, or returns.
theme: Color theme applied to the chart. Currently, the themes available are latimes (default), dark,
fivethiryeight, ggplot2, opaque, quartz, and vox.
Read next: Portfolios