Accounts
Trading Portfolios allows the monitoring of trading accounts, in addition to strategies and portfolios. However, you can't manually create an account, and neither other people will be able to view it.
Account information
Publishing agents, developed for specific platforms (such as MT4 and MT5), send the account data to the server. Updating the complete history is optional, but the agents will synchronize general account data, balance, and margin information, along with pending orders and open positions.
Learn more about publishing agents.
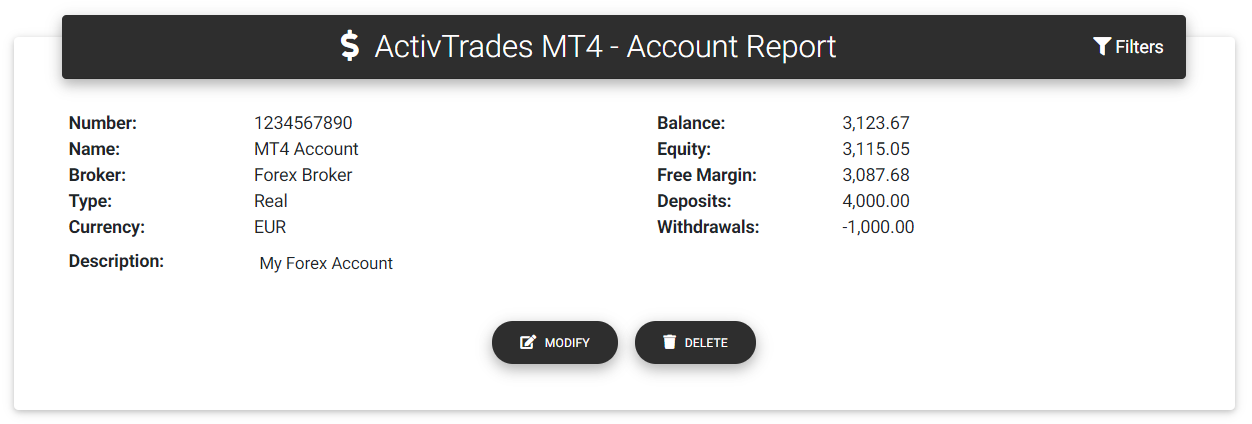
Account report
From the top menu or dashboard, you can access a comprehensive report of your trading accounts.
If you decide to update all account information using the publishing agents, here you will find all the statistics related to the trades performed in your account.
Filters
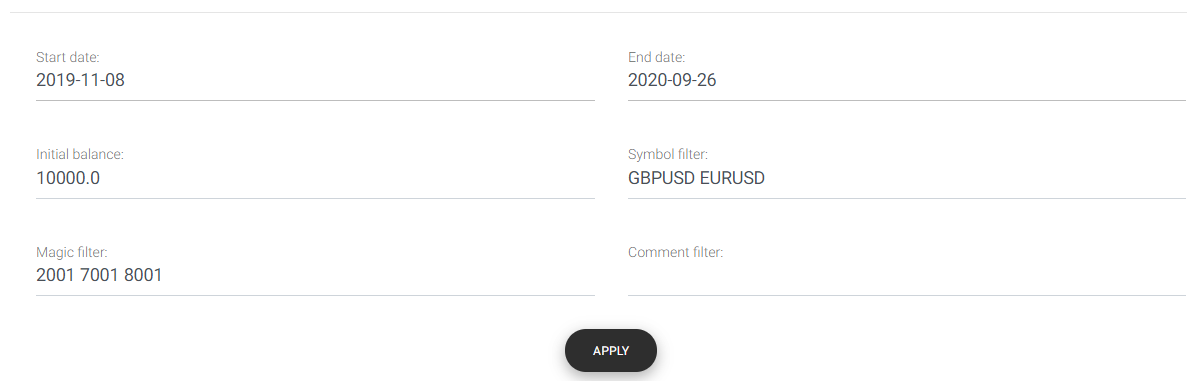
You may filter account data to evaluate some specific results. If you click on the "Filters" link, you will see a form with additional fields to filter the data.
Account filters
The first filter is the start and end dates. Use them to restrict the period of analysis. You can also define a different initial balance for the account. Sometime this is useful, speacially if your broker controls the account balance, following a risk control system. You can also define a custom balance if you find the statistics inaccurate.
The other three fields are text input filters that behave similarly. In the Symbol filter field, you can enter symbol names separated by whitespaces. Likewise, in the Magic filter, you may enter a list of magic numbers also separated by whitespaces. Finally, you can filter the trades based on the comment field.
Main statistics
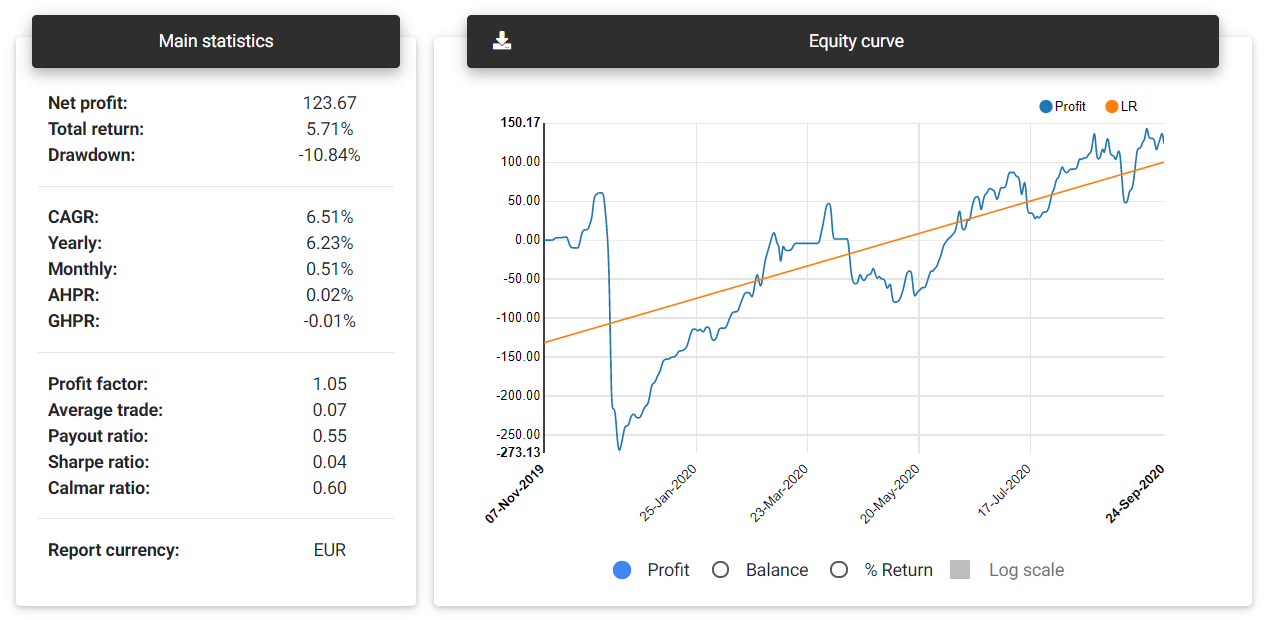
In the first part of the report, you will see the leading statistics and a chart with the equity curve. The card "Main statistics" shows the following information:
Main statistics and equity curve
Net profit: This is the total net profit achieved with your account in the selected period.
Total return: Indicates the account's percentage return based on the net profit and initial balance.
Notice: Some brokers change the account balance to adjust risk or deduct fees. Depending on the balance available, some calculations may be inaccurate. If you experience problems with the account report, you can try to define an initial balance using the filter form manually.
Drawdown: This is the maximum percentage drawdown verified in the balance. This measure indicates how much your balance has decreased after reaching any maximum point.
PROC: Pessimistic Return on Capital is an adjusted percentage return measure, considering the account's win rate and average profit. This measure can give a more conservative indication of the expected return for the account.
CAGR: Compound Annual Growth Rate is the annual return rate needed to obtain the final balance from the account's initial balance.
Yearly: Yearly return calculated for the account.
Monthly: Monthly return calculated for the account.
AHPR: Average Holding Period Return is the average return of each trade, which is the average balance change for each day.
GHPR: Geometric Holding Period Return is similar to AHPR but applies a weight with the number of trades.
Profit factor: The profit factor is the ratio between the sum of all profits and all losses.
Average trade: Average expected result per day, that is, the average daily profit from trades.
Payout ratio: It's the ratio between the average profit and the average loss. It gives an insight into the account's risk-reward ratio.
Sharpe ratio: It's the ratio of the account's net return (compared to a risk-free rate) and the standard deviation of these returns. To simplify the calculations, in this case, the risk-free rate is considered zero.
Calmar ratio: This metric can also be called the Drawdown ratio. It's the ratio between the average annual return and the maximum drawdown of the account.
Report currency: This is the account's currency.
Positions and Orders
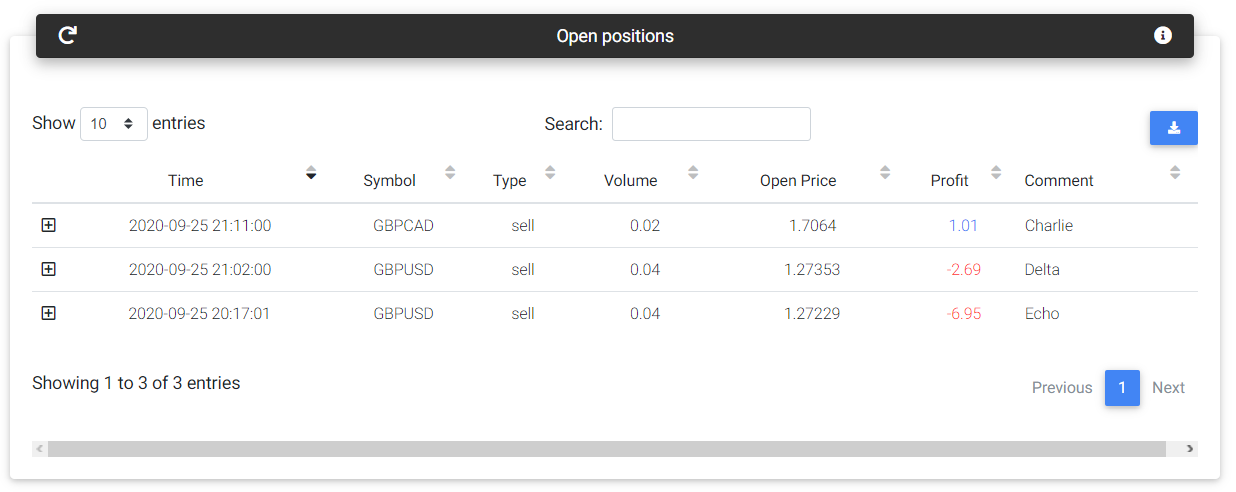
In this section, you can check all the open positions and pending orders detected in your trading account. There are two tables, the first showing the open positions and the second with the pending orders (not filled yet).
Open positions
This information is updated periodically in the database. If you want to follow the trades, you should update the tables using the refresh link available on the tables' top.
Account history
This section shows more details regarding the deals stored in the database. You will see a card with a trades summary by symbol and magic numbers.
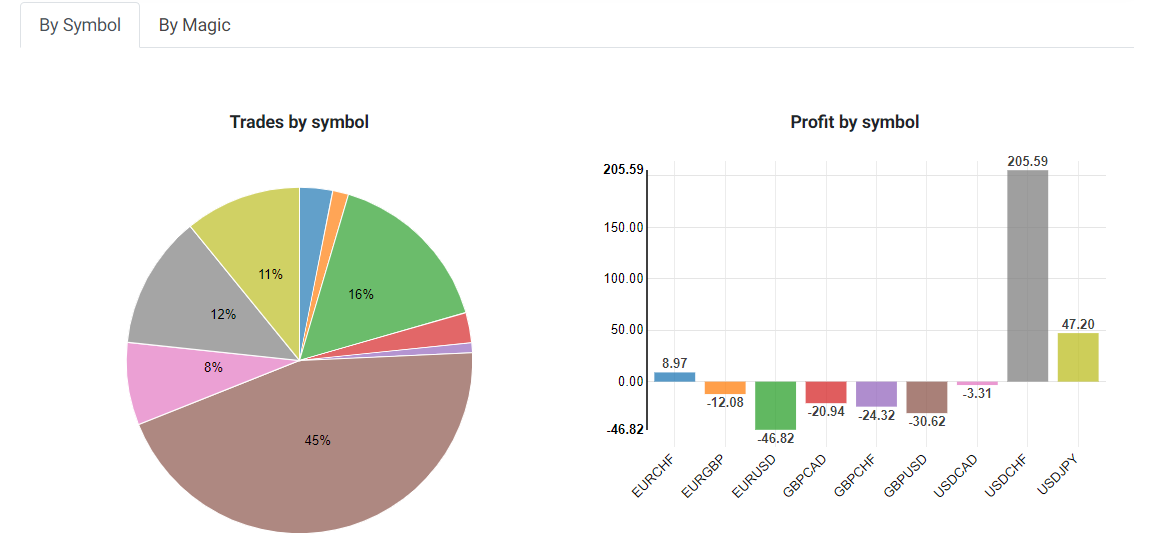
Summary by symbol
In both cases, the app will display a pie chart showing the percentage of trades for each symbol or magic and a bar chart with the accumulated profit by symbol or magic number. Below the charts you will find a table with additional information, including the number of trades, wins, and losses.
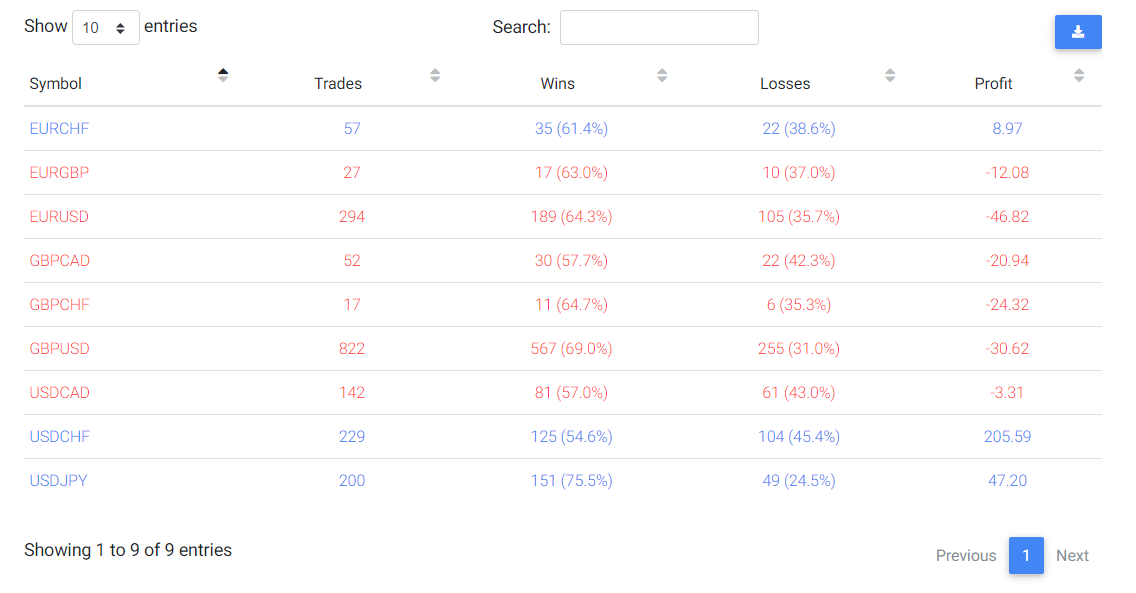
Symbol summary table
Following the summary, you can see a table with all the history available for the selected period and applied filters.
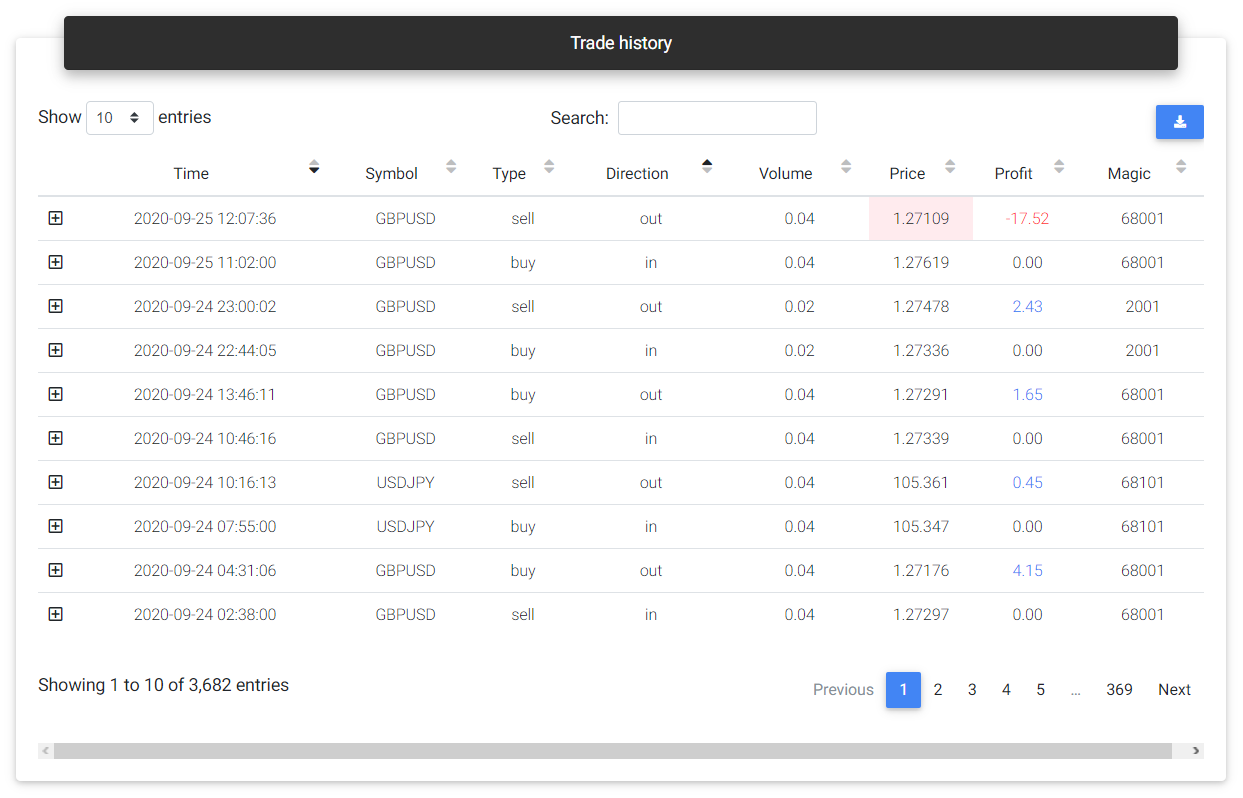
Trade history
Return analysis
Monthly returns
This card shows a bar chart with the account returns for each month available in history. You can see the results in percentage return, financial values, or points/pips. It's possible to select a specific year at the bottom of the chart to check the results.
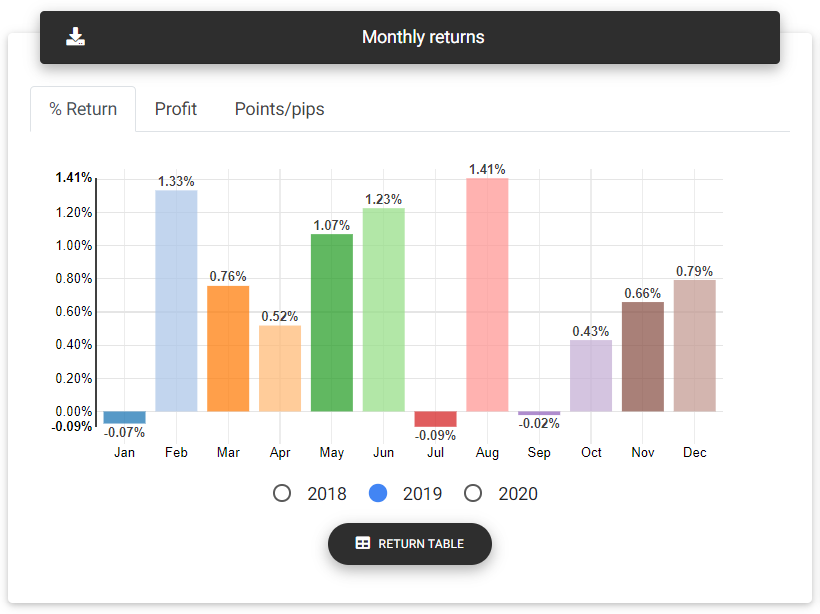
Monthly returns
Yearly returns
This card shows the accumulated result in each year in which the trades took place. You can see the results in percentage return, financial values, or points/pips.
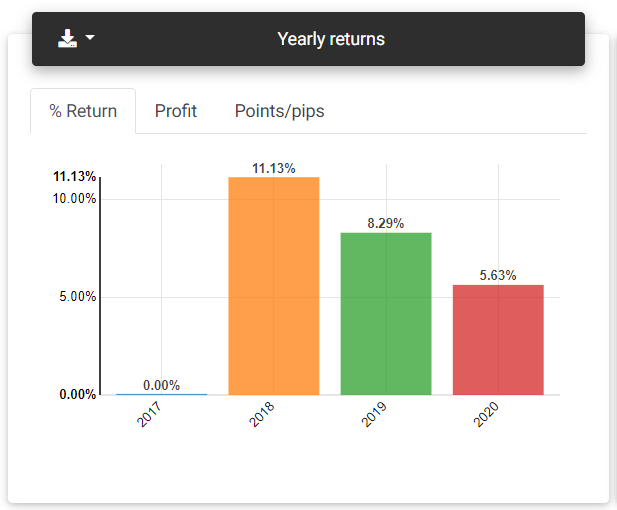
Yearly returns
Latest returns
From the charts presented in this card, you can see the account's recent results, referring to the day, week, and month, compared with the previous period.
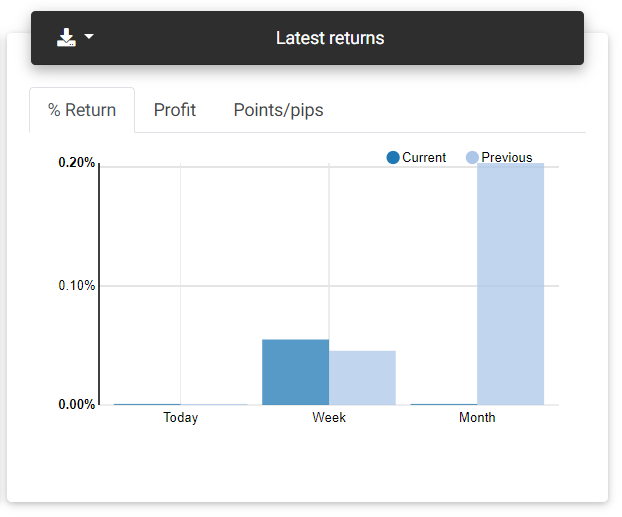
Latest returns
Daily returns
On this card, you find a table with the returns obtained each day, ending on the last day there was a trade on the history.
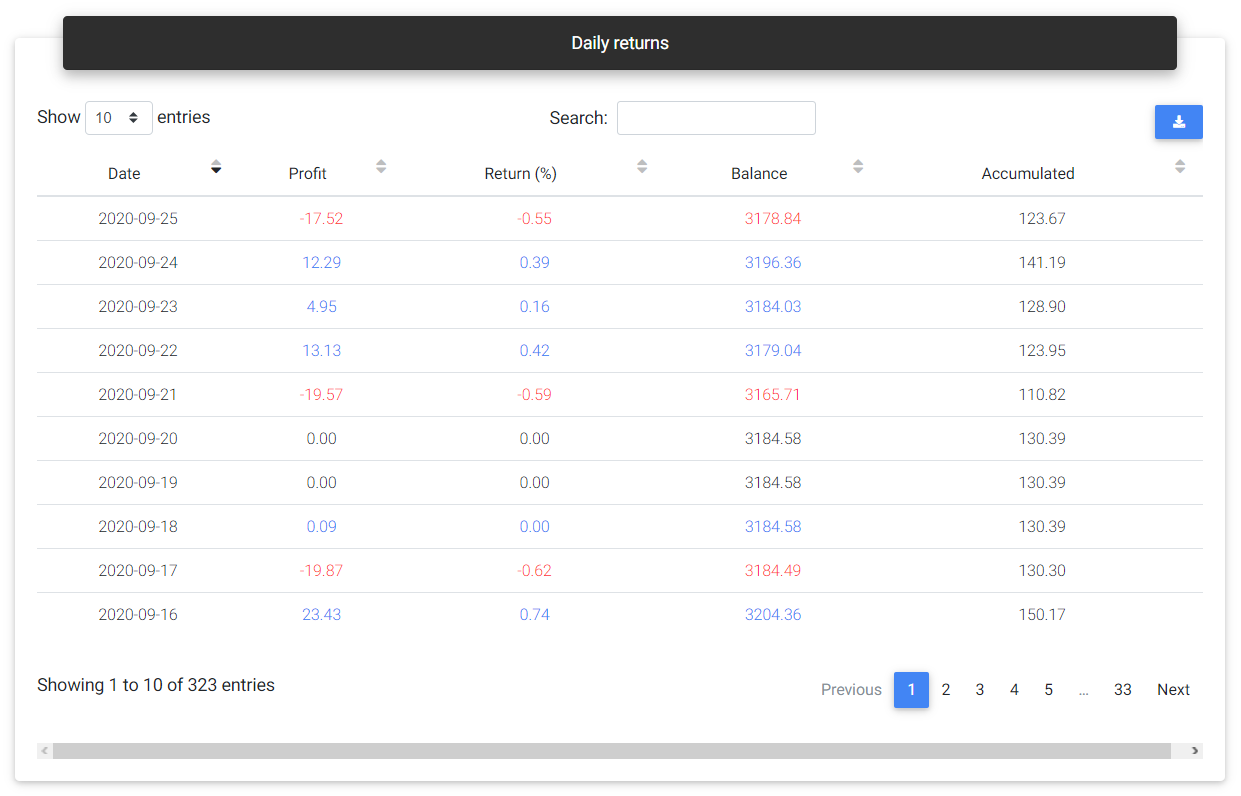
Daily returns
Return statistics
Today: Percentage return obtained on the current day.
This week: Percentage return achieved in the current week.
This month: Percentage return achieved in the current month.
This year: Percentage return achieved in the current year.
Best year: Highest annual percentage return ever achieved by the account.
Worst year: Lowest annual percentage return ever achieved by the account.
Best month: Highest monthly percentage return ever achieved by the account.
Worst month: Lowest monthly percentage return ever achieved by the account.
Monthly Sharpe: This is the Sharpe ratio calculated monthly.
Drawdown and risk
Risk of ruin
The risk of ruin considers past results to calculate the probability of losing some part or even the total capital invested in the account. Ideally, the account should have a higher probability of losing smaller portions of the capital and reducing probability as a greater loss is simulated. With a chart's aid, we expect to see a curve with a decline in the risk of ruin to something near zero as the loss is close to the entire capital.
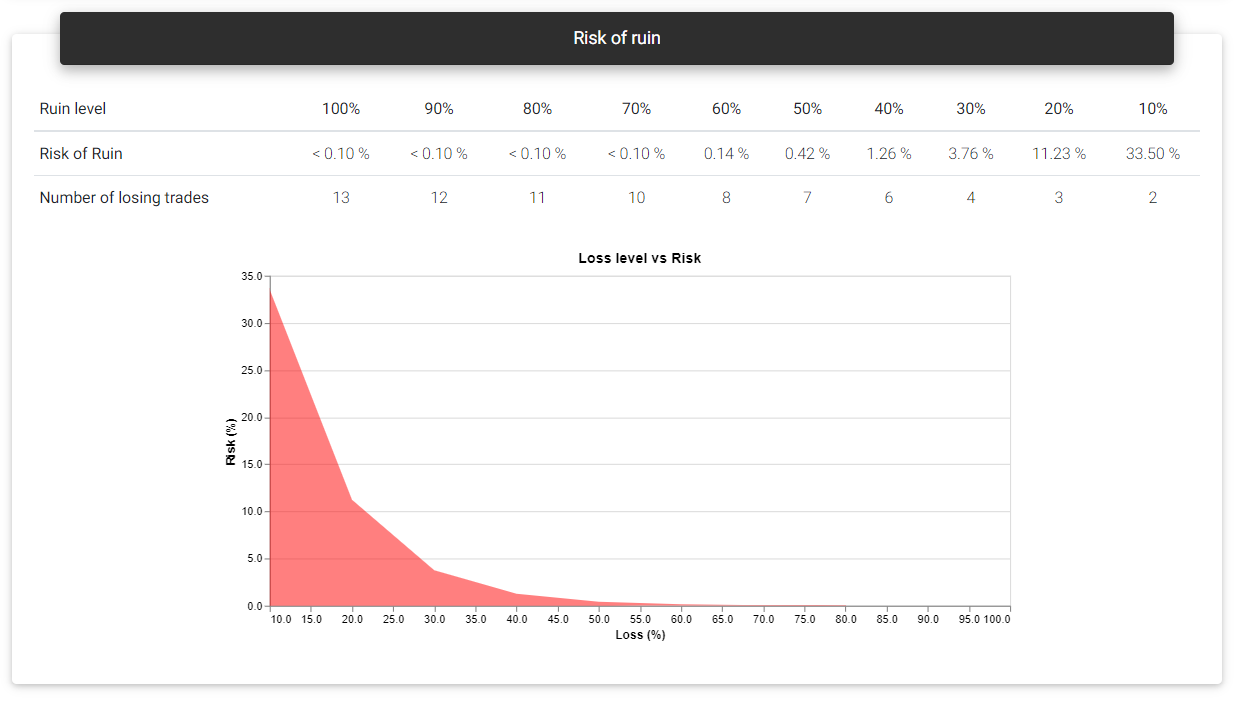
Risk of ruin
Drawdown statistics
Maximum relative: This is the highest percentage drawdown verified in history. The percentage drawdown tends to be higher in the first trades if the historical data contains fixed lot trades. In brackets, you see the financial value corresponding to this drawdown.
Maximum absolute: Largest financial drawdown value verified. In brackets, it's shown the percentage change corresponding to this drawdown.
From initial balance: The largest financial drawdown is applied to the initial balance to give you an idea of how much this value represents in percentage terms if you faced the drawdown in the first days.
Maximum duration: Shows the length of the longest drawdown measured in days.
Average duration: This is the average length of a drawdown measured in days.
Recovery factor: This is the total net profit divided by the maximum drawdown verified. This number gives an idea of the account's recovering power from drawdown periods.
Longest drawdowns
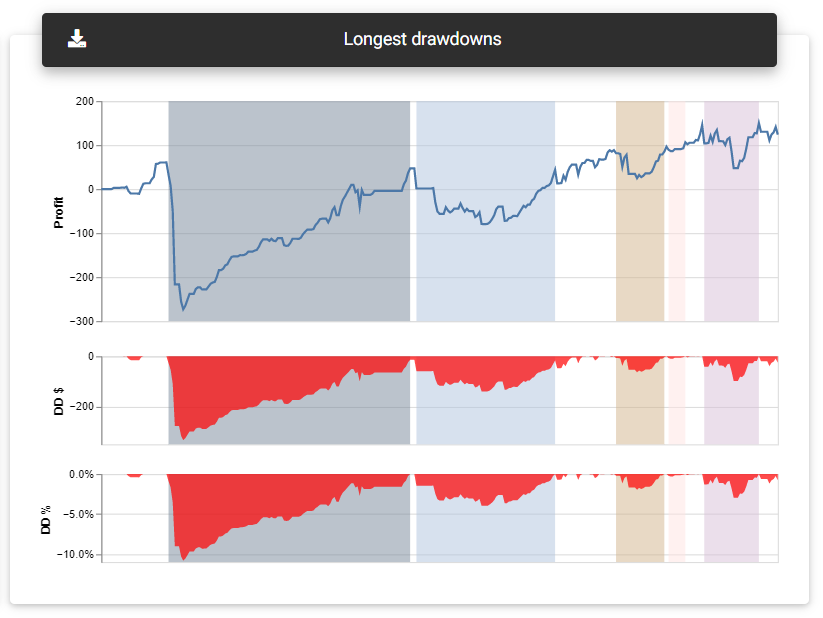
Drawdowns are common to all trading systems. Accounts spend most of their time on some drawdown, as any negative trade will start or continue such a move. What you should note is the duration and size of these drawdowns, which can represent a considerable loss of capital for a long time. On this card, a chart gives you a general idea of the drawdown periods faced by the account. The primary curve is profit growth, with the five most extensive drawdown periods indicated in different colors. Also, below the profit chart, three curves representing the same drawdown levels are plotted, one in points (volume independent), another with financial value, and the percentage drawdown. These curves will appear in red whenever the account remains in a drawdown period, and by hovering them, you can see the corresponding values.
Longest drawdowns
Drawdowns details
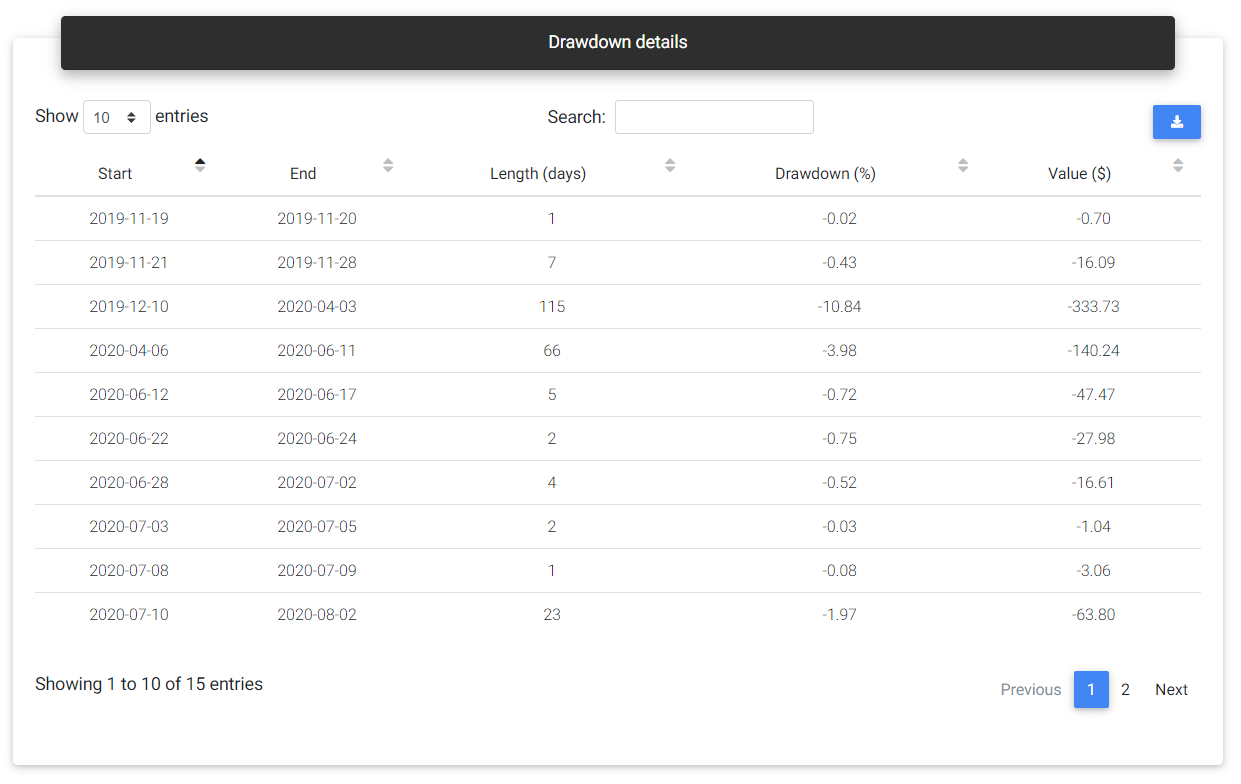
This table will show all the strategy's drawdown periods, indicating the start and end dates, duration, and corresponding values in percentage, financial, and points/pips.
Drawdown details
Trades and timing
Additional trade statistics
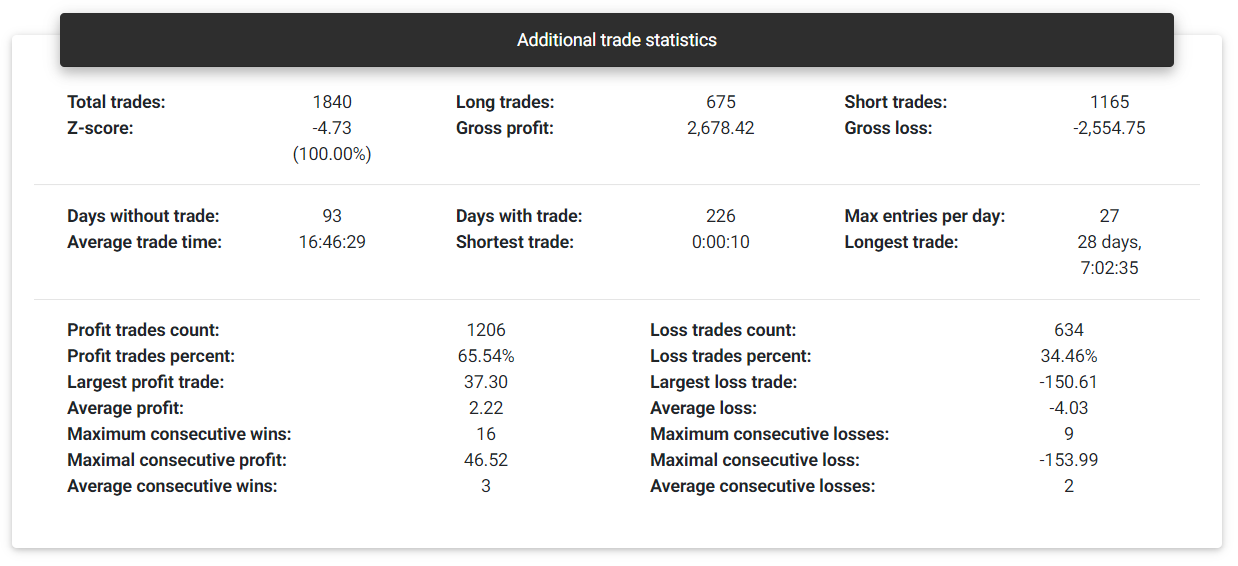
Additional statistics
Total trades: This is the total number of trades observed in history. The app counts each closed transaction as an individual trade. If there are partial closes, each one will be considered a different trade.
Long trades: Number of trades that started with a buy transaction.
Short trades: Number of trades that started with a sell transaction.
Gross profit: This is the sum of all trades that ended with a profit.
Gross loss: This is the sum of all trades that ended with a loss.
Z-score: With the Z-score, it is possible to assess whether the account will likely present sequences of gains or losses or whether the results will alternate. Negative Z-score values from -2.0 indicate a 95% probability that another profitable trade will follow a profitable trade, and likewise, a loss will be followed by another loss. Positive values starting from 2.0 suggest that with a 95% probability, a losing trade will follow a profitable trade and vice versa. Z-score values between -2.0 and +2.0 don't lead to a conclusion regarding the dependency between trades.
Days without trade: Number of days that there was no trade in this account.
Days with trade: Number of days that there was trade in this account.
Max entries per day: Maximum number of trades in a single day.
Average trade time: Average trade duration time.
Shortest trade: Indicates the duration of the fastest trade.
Longest trade: Indicates the duration of the most extended trade.
Profit trades count: Number of trades that ended with positive or zero results.
Profit trades percent: Percentage trades that ended with positive or zero results.
Loss trades count: Number of trades that ended with negative result.
Loss trades percent: Percentage trades that ended with negative result.
Largest profit trade: Highest profit achieved in a single trade.
Largest loss trade: Highest loss achieved in a single trade.
Average profit: Average result from trades with profit.
Average loss: Average result from trades with loss.
Maximum consecutive wins: Maximum number of consecutive trades with profit.
Maximum consecutive losses: Maximum number of consecutive trades with loss.
Maximal consecutive profit: Highest profit achieved in consecutive trades.
Maximal consecutive loss: Highest loss achieved in consecutive trades.
Average consecutive wins: Average number of consecutive profitable trades.
Average consecutive losses: Average number of consecutive losing trades.
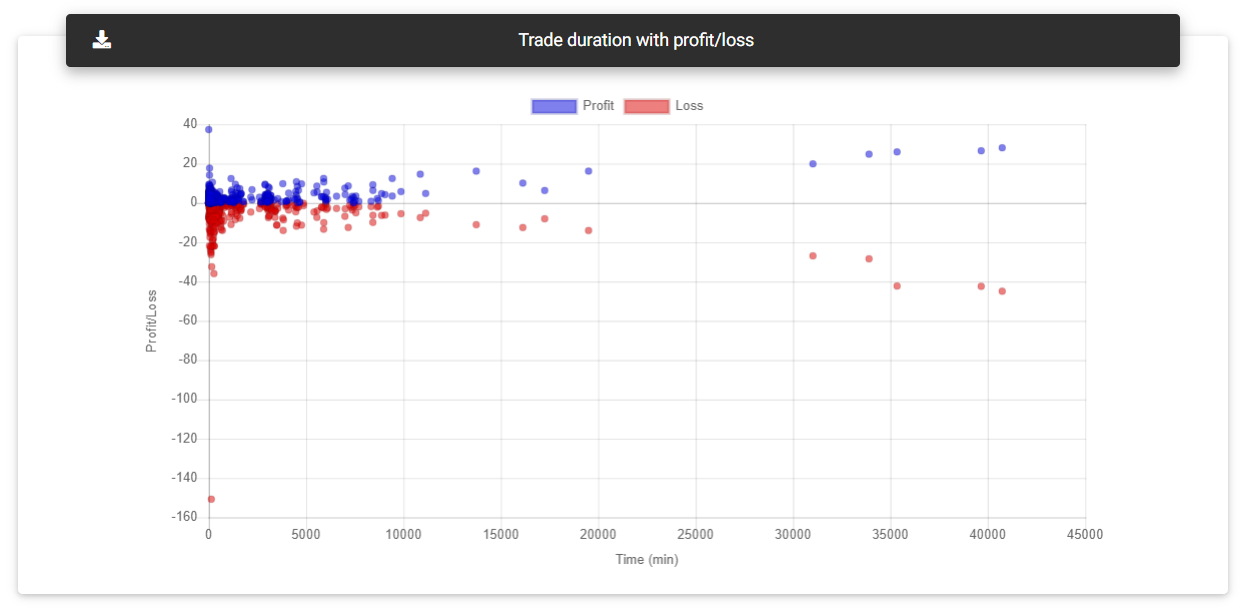
Trade duration with profit/loss
This card presents a chart with each trade result, with the profit represented on the y-axis and the x-axis trade duration in minutes.
Trade duration
Entries charts
Entries charts show the number of trades started for each hour of the day, day of the week, and month.
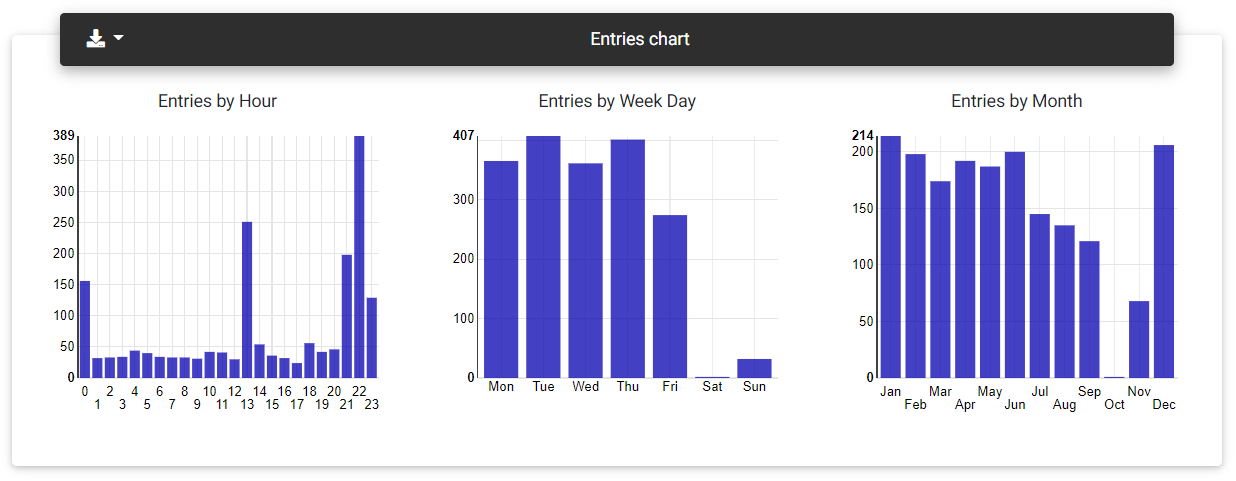
Entries charts
Profit/Loss charts
These charts show the sum of profits and losses obtained at each hour of the day, day of the week and month.
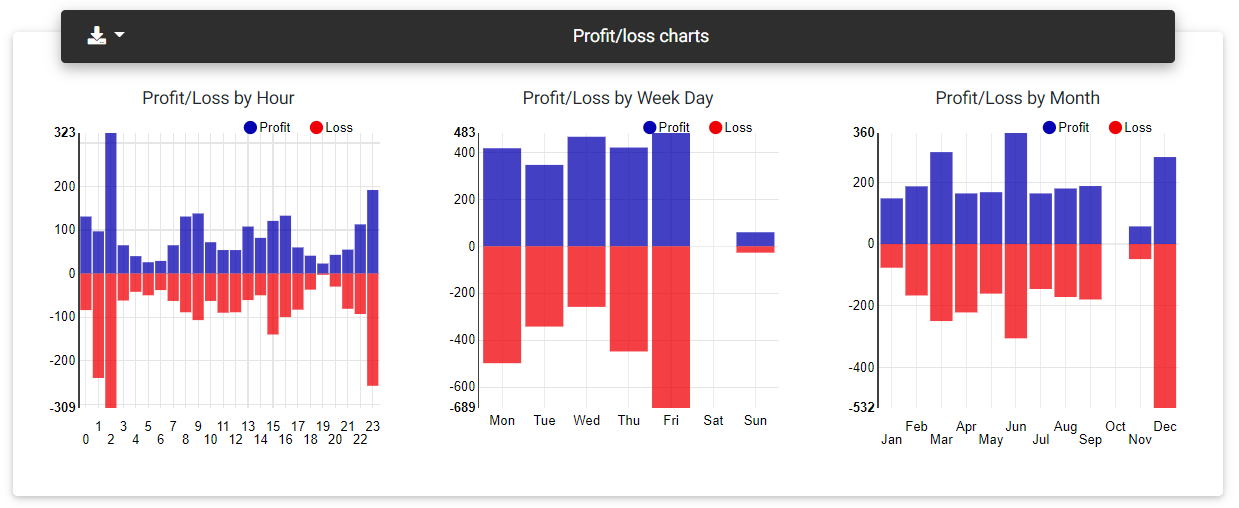
Profit/loss charts
MFE/MAE with profit
MFE is the Maximum Favorable Excursion achieved during the trade, indicating the largest price swing favorable to the trade, and consequently, the highest open profit. MAE (Maximum Adverse Excursion) is the opposite, meaning the largest price swing against the trade, representing the largest open loss. This chart shows a plot that relates the measures of MFE and MAE with the final trade result.
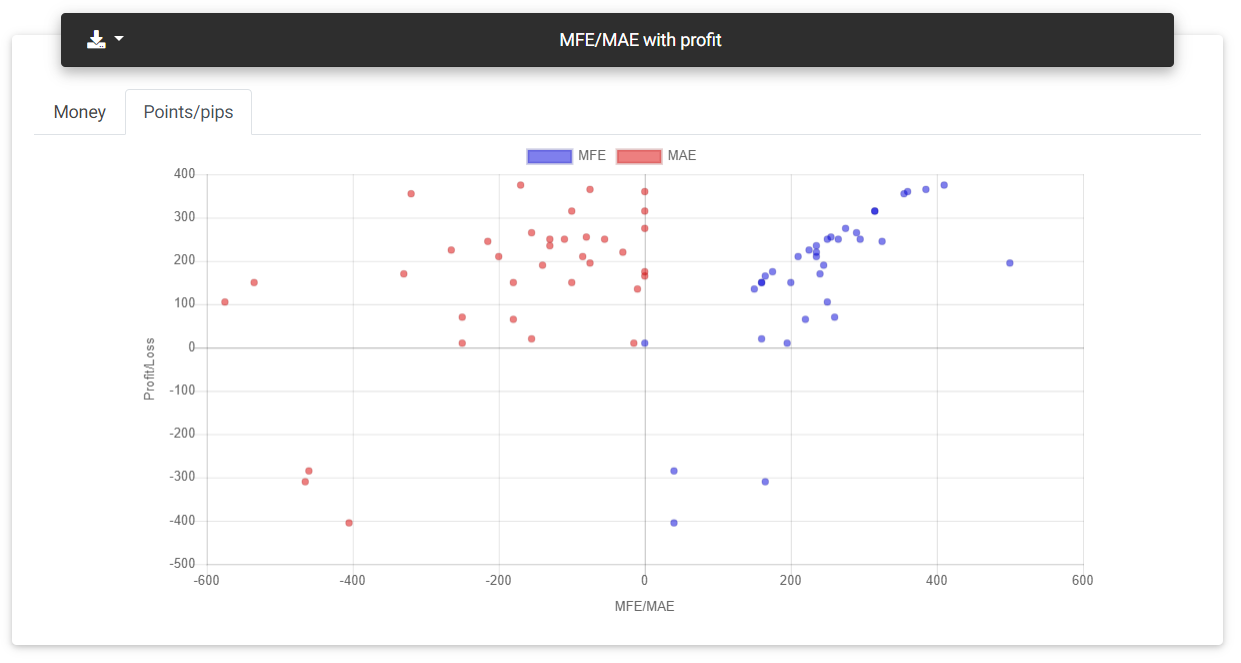
MAE/MFE
Read next: User Profile