Monte Carlo Analysis
When we test a strategy with historical data, we get a sequence of results that can be satisfactory if analyzed superficially. But, past results will not necessarily happen the same way in the future. By nature, trade results are random. After all, when a strategy initiates a trade, it is impossible to know whether it will end with profit or loss. Everything will depend on the market dynamics, over which we have no control.
And what would the result be for the same historical data if it had happened in a different order? For example, if there were initially a large number of losing trades, could this have compromised all of the initial capital?
These and other questions can be clarified using the Trading Portfolios' Monte Carlo Analysis tool. The idea is to take past results and generate a new sequence at random, repeating this process several times to obtain a statistical distribution. With that in mind, we can estimate with a reasonable degree of confidence the maximum expected drawdown for a strategy.
Configuration
To perform Monte Carlo simulations, you should define some settings in the main form. Below, you find all parameters description.
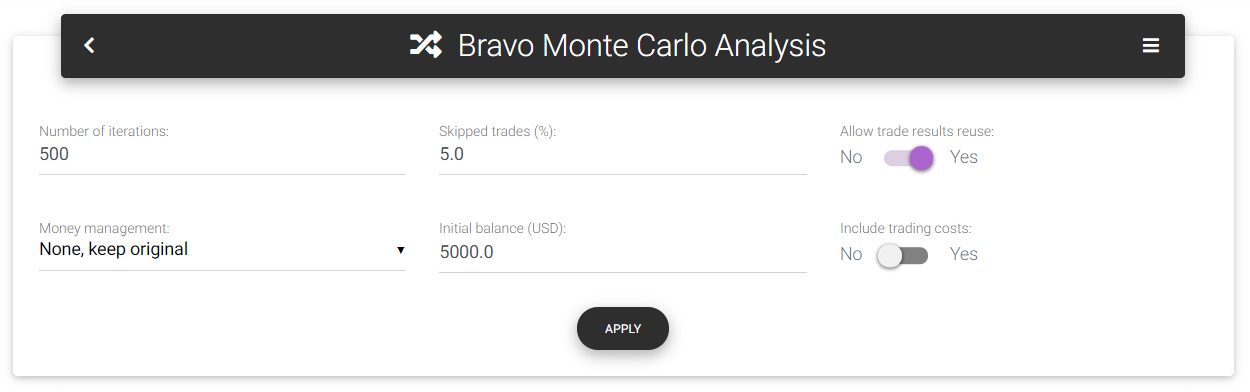
Monte Carlo settings
Number of iterations: The number of simulations with random sequences that the tool will produce. The higher the number, the more reliable is the result. However, the calculation time will be considerably longer. For performance reasons, the maximum number of simulations is limited in this tool.
Skipped trades (%): This parameter defines a percentage of the trades the tool will discard in each iteration. Using this, you can create a greater degree of randomness since the final result will not be the same for all simulations. If you leave this parameter as zero, you will see that all the simulated curves will arrive at the same ending point since the total sum will be the same regardless of the results sequence. Another function of this parameter is to simulate and forecast trading progress for shorter periods. For example, suppose you have two years of track record tested, and you are interested in estimating what the outcome and possible drawdown would be for the first six months of trading. In this case, you could skip 75% of the trades to generate simulations proportional to six months of trading.
Allow trade results reuse: With this option, it's possible to generate even more randomness in the simulations. If the strategy already faced an outlier loss, it's not impossible to suffer that loss again in the future, even more than once. When setting this parameter to true, the simulation's trade results remain available for reuse, allowing the repetition of historical results.
Money management: With this parameter, you can select a specific money management technique to be applied following the equity growth. For example, if you have a backtest result with a single contract, you can select a position sizing strategy to be used over the simulated period in all iterations. That way, you will identify what drawdown level you could face when applying techniques that significantly increase trading volume. The following options are available: "None, keep original" (use only historical results without volume changes), "Fixed lot," "Fixed percent," "Fixed ratio," "Fixed capital," "Martingale." Depending on the selected money management method, the tool will display other configuration fields, as presented for the Money Management tool.
Initial balance: This is the starting balance used in the simulations. You can increase the balance if you notice that the drawdown is too big to compromise a significant portion of the capital. This way, you can estimate the capital needed to run the strategy.
Include trading costs: By default, simulations use only gross results, without including any costs. If you are interested in considering trading costs to make the results more realistic, you can check this option.
Statistics and histograms
On the main page, you will find some statistics regarding the simulations performed with the historical data:
Number of iterations: Actual number of iterations performed. This number can be less than the number entered by the user if it has exceeded the internal limit.
Trades per iteration: Indicates how many trades the tool used to set up each random sequence. It's the total number of trades in history reduced by the percentage defined in "Skipped trades (%)."
Initial balance: This is the initial deposit used in the simulation to generate equity growth.
Mean final balance: Mean final balance calculated from all iterations.
Minimum balance reached: Indicates the lowest balance perceived among all iterations.
Max drawdown from initial balance: Taking the maximum financial drawdown verified through all iterations, it defines what percentage value it would represent if applied directly to the initial balance.
Maximum final balance: Indicates the highest final balance, calculated with 99% confidence from the mean.
Maximum total return: Indicates the highest percentage return, calculated with 99% confidence from the mean.
In the Distribution statistics table, you can see some metrics calculated based on the iterations performed. Calculated metrics are Drawdown (%), Drawdown ($), Final balance, and Total return. The mean, standard deviation, maximum with 95% confidence, and maximum with 99% confidence are presented for each metric.
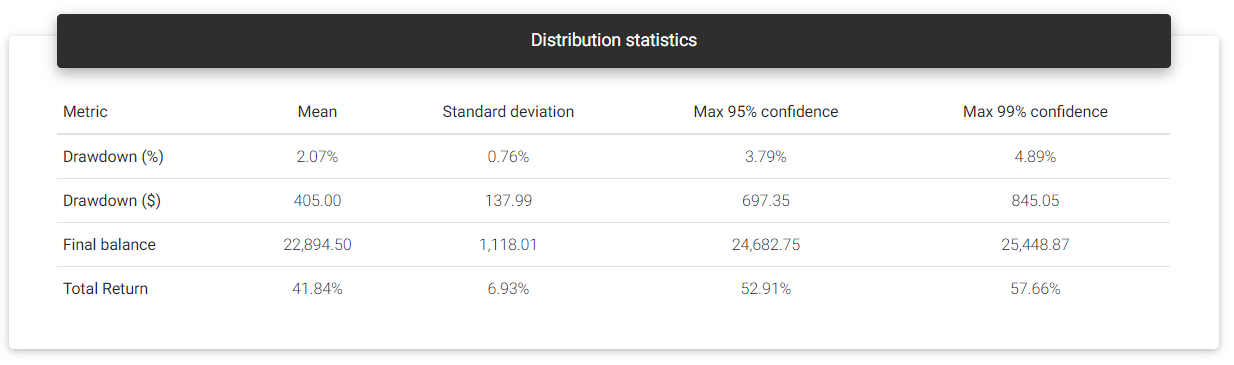
Distribution statistics
Right below, you can see the results of all iterations in the form of histograms. For each metric value range (x-axis), you see the number of iterations (y-axis) whose result was in that range. With that, you could notice a distribution of results with a higher concentration of iterations close to a mean value and reducing the amount as it deviates from the mean. The tool plots two vertical lines on the histogram: The first in orange indicates the calculated mean value. The second in red shows the maximum value within two standard deviations (95%) of the samples.
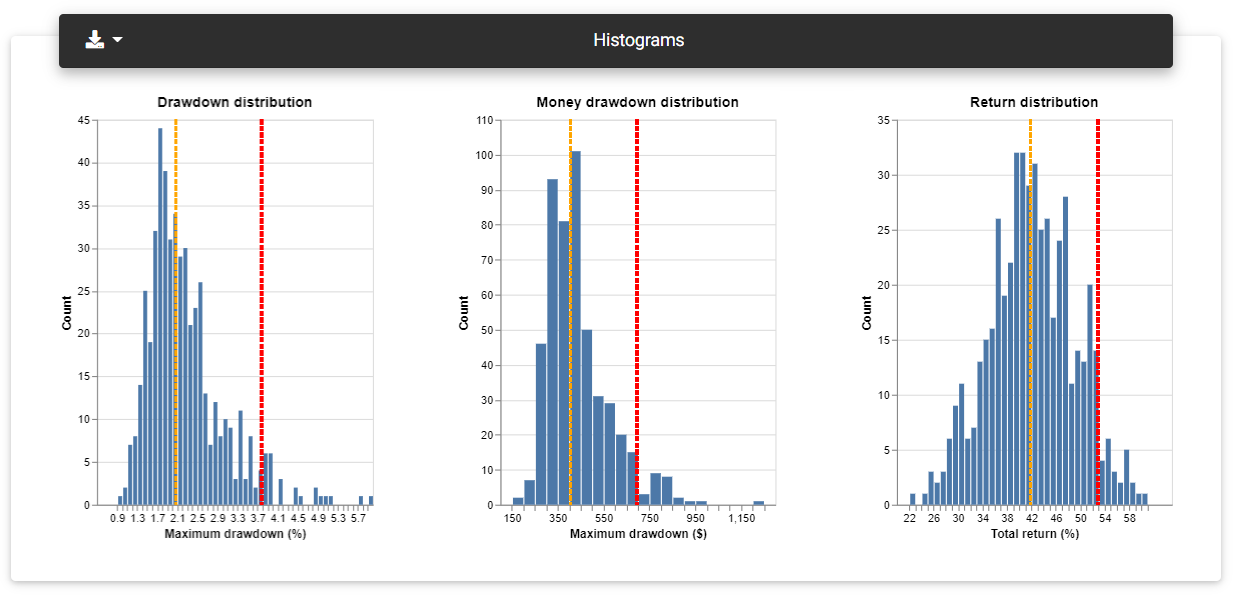
Distribution histograms
Loss probability
This section presents a table with the risk of losing a portion of the invested capital. The first column (Loss level) indicates the percentage loss level. The second column shows the probability of loss, which means the percentage of iterations that led to a loss at the corresponding level. Finally, the column "Number of iterations" shows the absolute number of iterations that reached that level of loss.
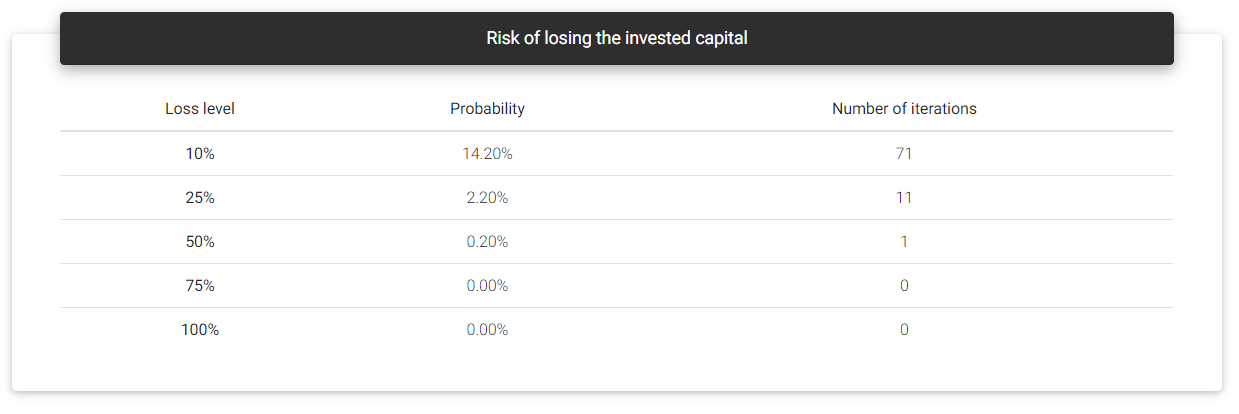
Loss probability
Equity curves
When we see a Monte Carlo simulation description, we often find a chart with several overlapping equity curves. It's no different here, although you can find the most important data in the histograms. The Equity curves section shows the balance curves representing the most relevant iterations: the original result, highest percentage drawdown, highest financial drawdown, lowest profit, highest profit, and lowest balance.
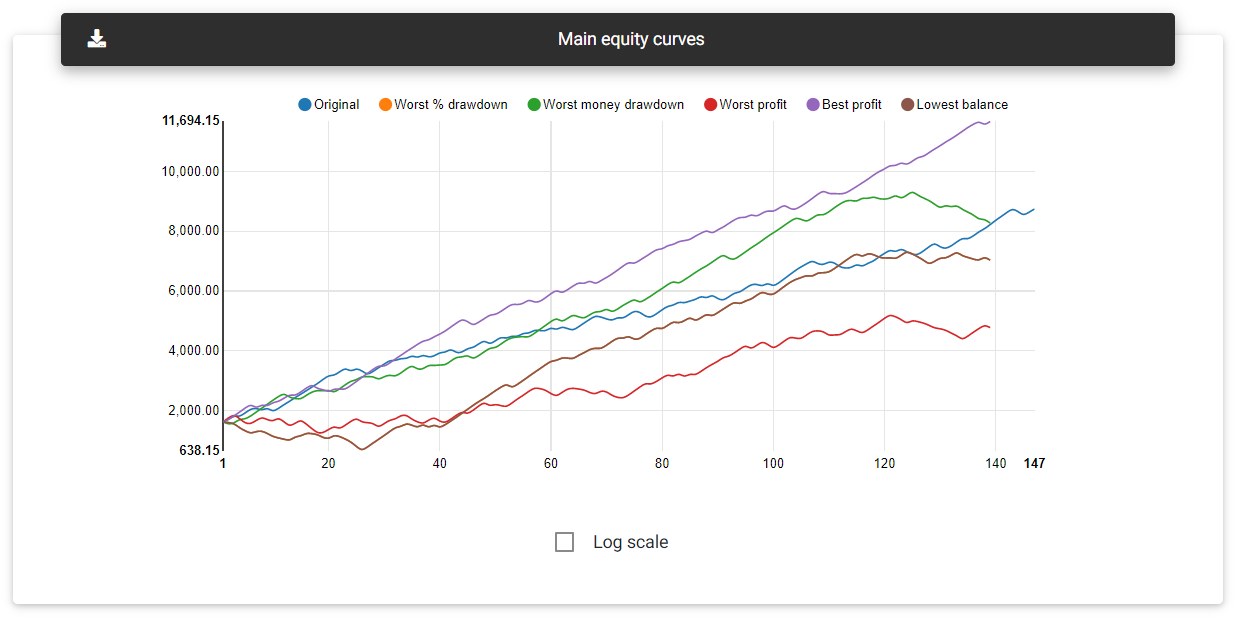
Main equity curves
It is also possible to load all simulated equity curves by clicking on the "Load all" button. This chart may take a while to load due to the amount of data the browser needs to download.
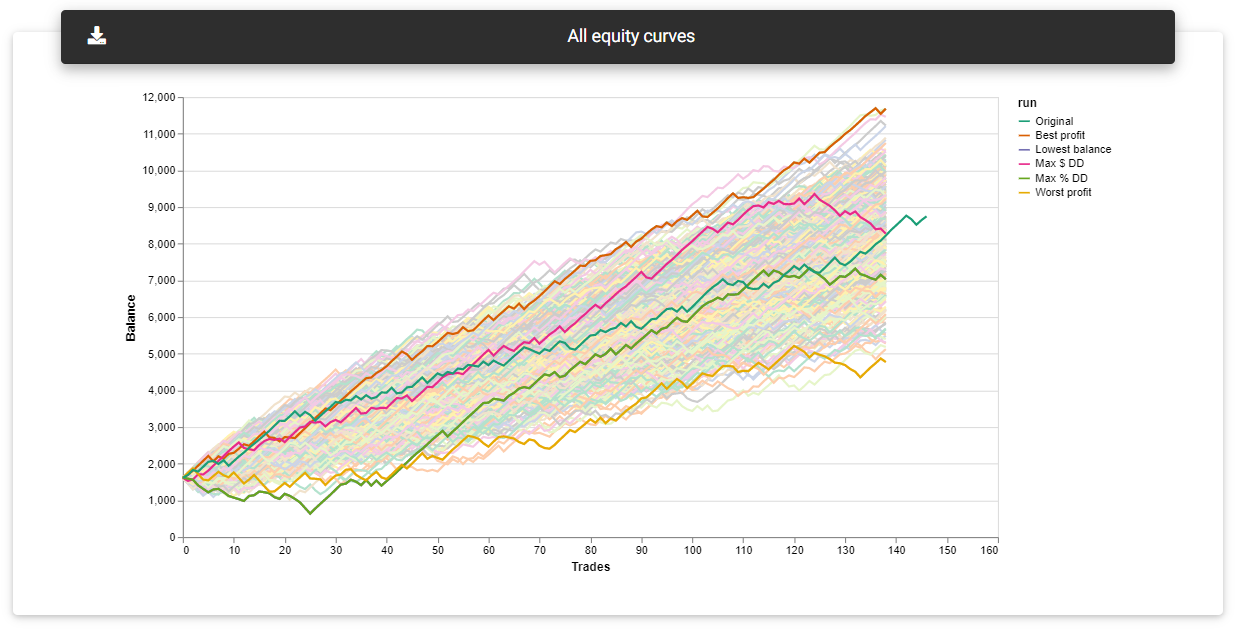
All equity curves
Read next: Optimization Analysis