Portfolio Allocation
After defining which strategies will be part of a portfolio, the next step is to determine what capital you should allocate to each one. In a stock portfolio, the concept is more straightforward. Given a total financial amount, the investor defines what value and, consequently, how many shares of each stock she will purchase. In the case of automated trading strategies, it may be a little less clear, but the idea is similar.
If you have limited capital for automated trading, it might be attractive to apport more capital to some strategies and less to others. This will represent how much risk you can set on each strategy and, consequently, the volume traded. You can also choose not to allocate capital for one strategy in a portfolio context, keeping it disabled while distributing capital to others.
In theory, this distribution is made linearly, but it may not be possible to apply due to trading assets' volume restrictions in practice. For example, generally, the smallest variation on futures exchanges will be 1.0 contract. By calculating the allocation, you could find an amount representing 0.61 contracts, which on many exchanges would not be possible to execute. With Forex brokers and CFDs, it is currently possible to trade micro-lots on several instruments, which greatly improves the possibility of trade scaling.
Efficient Frontier
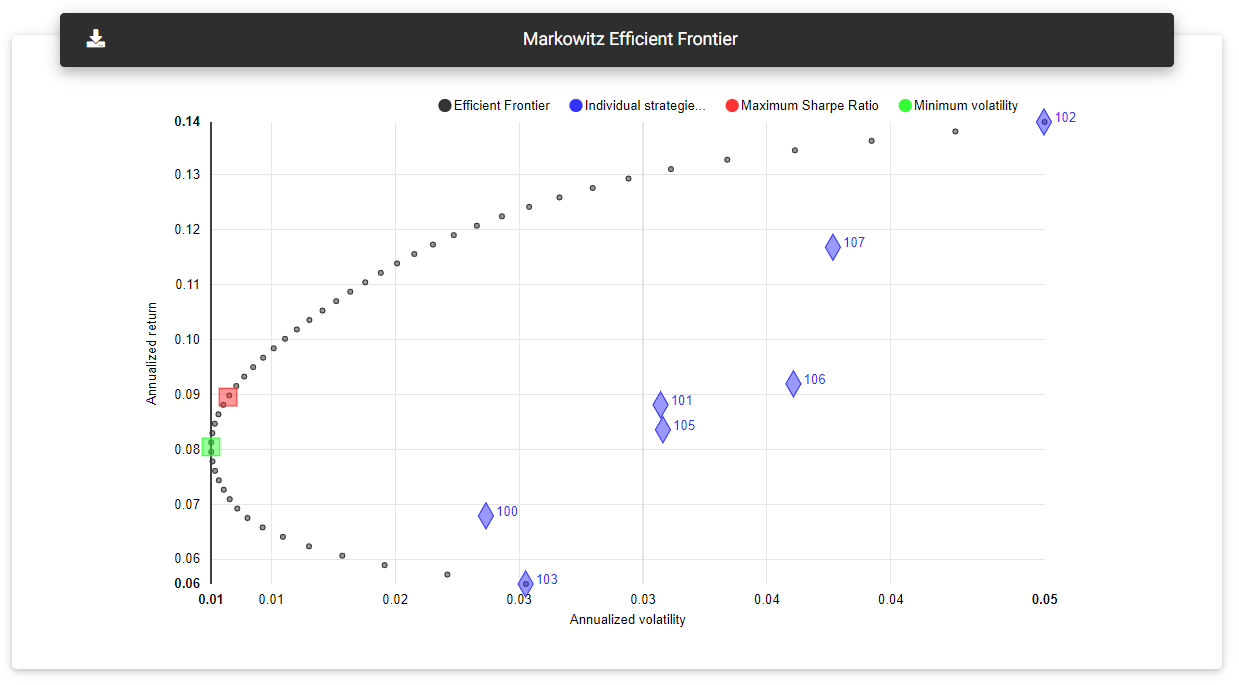
Harry Markowitz presented the Efficient Frontier theory in 1952, representing a set of optimized portfolios that generate the greatest return for a given level of risk. It usually appears on a risk vs. return chart with a bullet-shaped line, and any allocation to the right of this line is considered sub-optimized. An optimized allocation on the efficient frontier line would give us the weights applied to each strategy to achieve that final return at a specific risk level.
Efficient Frontier
We can also optimize the allocation by looking for sets of greater interest. For example, calculate the allocation that would provide less volatility to the portfolio. On the other hand, we also look for the one that results in a higher Sharpe Ratio, a risk-adjusted return measure.
This section shows a chart representing the Efficient Frontier calculated on the strategies' results. The Efficient Frontier appears as a set of black dots, which generally ranges from the strategy with the lowest return to the strategy with the highest annual return.
In blue, you can see each strategy's risk/reward ratio plotted individually. The portfolios optimized for lower volatility and higher Sharpe Ratio are represented in green and red, respectively.
Strategies allocation
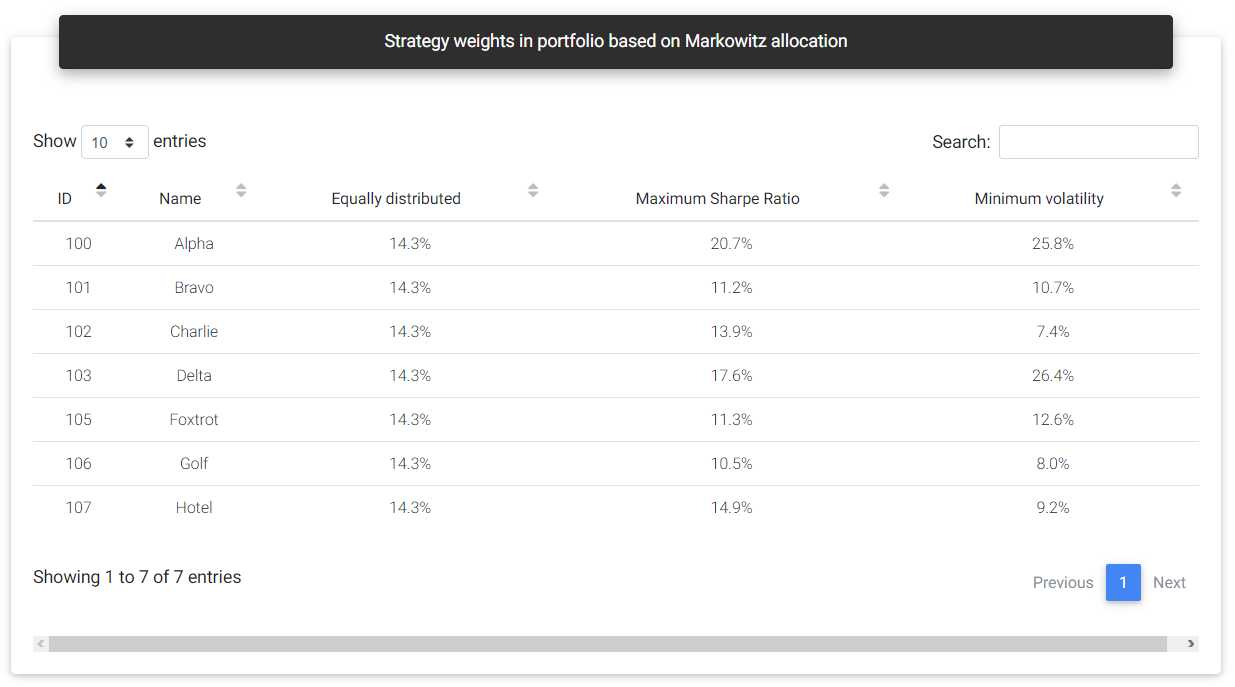
In this section, you can see the weight distribution for each simulated allocation. The first case would be an equal distribution, where capital is divided equally for all strategies. In this case, the percentage allocation value will be the same for all strategies in the portfolio.
Strategy weights
You can see the suggested distribution for portfolios with a higher Sharpe Ratio and minimum volatility in the other two columns. Some strategies may weigh more than others in these allocations, and zero weight can be assigned to them, indicating that they should be disabled in that composition. For example, if two strategies have a high positive correlation, the tool will probably assign zero weight to the one with the worst performance.
Allocation comparison
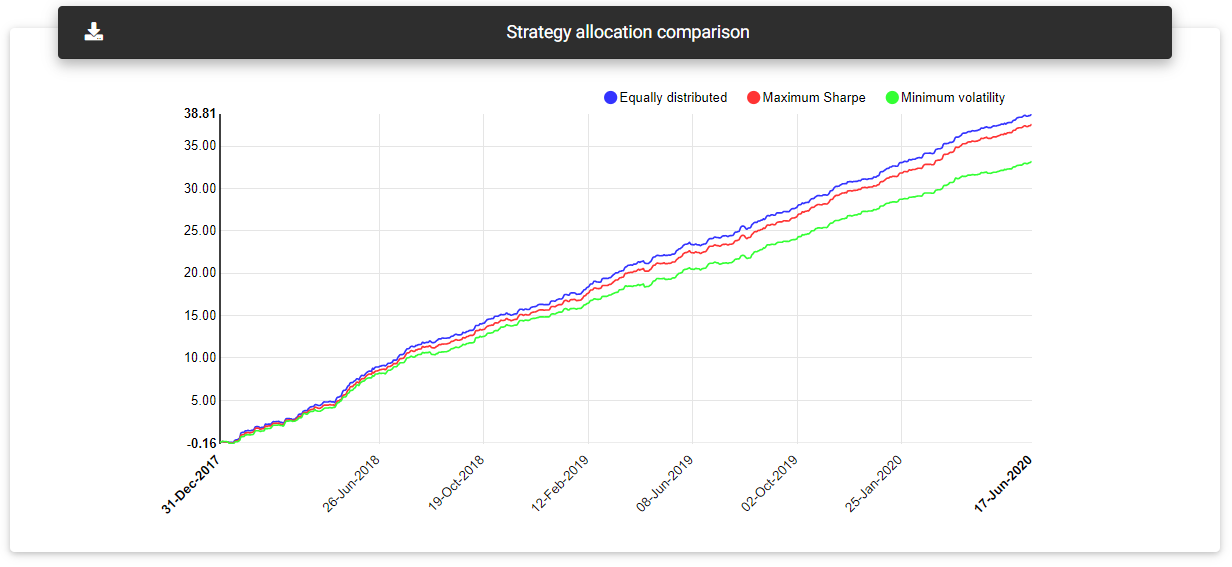
In addition to the table with the strategy's weights in the three types of allocation, you will see a chart with each case's equity growth. This chart allows you to compare the performance of the distributions over the time available in the history.
Read next: Publishing Agents